Article

Comparative Mitogenomics of True Frogs (Ranidae, Anura), and Its Implications for the Phylogeny and Evolutionary History of Rana

1
Jiangsu Key Laboratory for Biodiversity and Biotechnology, School of Life Sciences, Nanjing Normal University, Nanjing 210046, China
2
College of Environment and Ecology, Jiangsu Open University (The City Vocational College of Jiangsu), Nanjing 210036, China
3
Nanjing Institute of Environmental Sciences, Ministry of Environmental Protection, Nanjing 210042, China
4
Analytical and Testing Center, Nanjing Normal University, Nanjing 210046, China
*
Authors to whom correspondence should be addressed.
Animals 2022, 12(10), 1250; https://doi.org/10.3390/ani12101250
Submission received: 28 January 2022 / Revised: 9 May 2022 / Accepted: 9 May 2022 / Published: 12 May 2022
(This article belongs to the Section Animal Genetics and Genomics)

Abstract

:

Simple Summary

The true frogs of the genus Rana are a complex and diverse group. Many new species have been discovered with the help of molecular markers and morphological traits. However, the evolutionary history in Rana were not well understood. In this study, we sequenced and annotated the complete mitochondrial genome of R. longicrus and R. zhenhaiensis. In 13 protein codon genes, the COI was the most conserved, and ATP8 had a fast rate of evolution. The Ka/Ks ratio analysis among Rana indicated the protein-coding genes were suffering purify selection. There were three kinds of gene arrangement patterns found. This study provides mitochondrial genetic information, improving our understanding of mitogenomic structure and evolution, and recognizes the phylogenetic relationship and taxonomy among Rana.

Abstract

The true frogs of the genus Rana are a complex and diverse group, containing approximately 60 species with wide distribution across Eurasia and the Americas. Recently, many new species have been discovered with the help of molecular markers and morphological traits. However, the evolutionary history in Rana was not well understood and might be limited by the absence of mitogenome information. In this study, we sequenced and annotated the complete mitochondrial genome of R. longicrus and R. zhenhaiensis, containing 22 tRNAs, 13 protein-coding genes, two ribosomal RNAs, and a non-coding region, with 17,502 bp and 18,006 bp in length, respectively. In 13 protein codon genes, the COI was the most conserved, and ATP8 had a fast rate of evolution. The Ka/Ks ratio analysis among Rana indicated the protein-coding genes were suffering purify selection. There were three kinds of gene arrangement patterns found. The mitochondrial gene arrangement was not related to species diversification, and several independent shifts happened in evolutionary history. Climate fluctuation and environmental change may have played an essential role in species diversification in Rana. This study provides mitochondrial genetic information, improving our understanding of mitogenomic structure and evolution, and recognizes the phylogenetic relationship and taxonomy among Rana.

1. Introduction

The Ranidae (Anura) is comprised of 24 genera and approximately 434 species worldwide [1]. The true frogs of the genus Rana are a complex and diverse group that are widely distributed across Eurasia and the Americas [2,3]. Due to their body coloration and habitat preferences, the species in Rana are commonly known as brown frogs or wood frogs [4,5,6]. In the genus Rana, approximately 60 species are recorded in the world [7], and five of seven clades exist in China [2], including 25 species have been recorded [8]. The conservative morphology of Rana makes many species difficult to identify [9]. Moreover, with the rapid and notable developments in the knowledge about the true frogs, many new species have been discovered in China with the help of molecular markers associated with morphological traits in recent years [4,10,11,12]. The recent study of new species descriptions has accelerated quickly, suggesting that insufficiently explored regions may contain many cryptic new species, indicating that the diversity of this genus is probably underestimated [13,14].
The typical mitochondrial genome (mitogenome) of vertebrates is a closed ring structure with a size range of 15–21 kb, which contains 13 protein-coding genes (PCGs), 2 ribosomal RNAs (rRNAs), 22 transfer RNAs (tRNAs), and one non-coding region (D-loop) [15,16]. Due to its small genome size, compact gene arrangement, high conservation, low sequence recombination, maternal inheritance, and easy detection, mitogenome provides a valuable resource for further study of molecular systematics, population genetics, comparative or evolutionary genomics [17,18,19,20]. To date, the advances of next-generation sequencing (NGS) techniques offer new opportunities for rapid increasingly high data quality of mitogenomes [21,22].
Recent studies have discovered many new species in the genus of Rana from China and revised several taxonomic arrangements, indicating that the diversity and taxonomy of the Rana are still not well understood [11]. True frogs are extensively used as model organisms in studies of development, genetics, physiology, behavior, ecology, and evolution [2]. Despite recent rapid increases in the available information on Rana mitogenomes, only 20 complete mitogenomes sequences have been reported in GenBank (accessed on 24 October 2021, Table 1). However, the basic genetics information and characterization of mitogenome of Rana are unclear.
In this study, we sequenced and annotated the complete mitogenome of two Rana species (R. longicrus and R. zhenhaiensis). The genome composition and characteristics were analyzed, the relative synonymous codon usage (RSCU) and AT-skew values of the PCGs were calculated. Furthermore, we analyzed phylogenetic relationships, gene arrangement, and selective pressures among Rana species. In the future, sequencing more mitogenomes from various taxonomic levels will provide useful information for better understanding the evolutionary history and will contribute to further taxonomic research within Ranidae.

2. Materials and Methods

2.1. Sample Collection and DNA Extraction

The samples of R. longicrus was collected from Chiu-ling Mountains, Jiangxi Province, China (29°12′14.47′′N, 114°52′4.42′′E), and R. zhenhaiensis was collected from Tianmu Mountains, Zhejiang Province, China (30°11′0.75″N, 119°27′56.64″E). After collection, the muscles were initially preserved in 75% ethanol for two days, then preserved in 95% ethanol, and finally transferred to −20 °C in the laboratory for long-term storage in Nanjing Normal University. Total genomic DNA was extracted using a DNAeasy tissue kit (Qiagen, Hilden, Germany) following the manufacturer’s instructions.

2.2. Library Preparation and Sequencing

The extracted DNA was then sent to Novogene (Beijing, China) for sequencing on the Illumina sequencing platform. The concentration of DNA was checked with a Nanodrop 1000 Spectrophotometer (Thermo Scientific, Waltham, MA, USA). The extracted DNA was sheared to 400–600 bp using an ultrasonic technique. The sequencing library was produced using the Illumina Truseq DNA Sample Preparation Kit (Illumina, San Diego, CA, USA) according to the manufacturer’s instructions. The prepared library was loaded on the Illumina Novaseq 6000 platform for PE 2 × 150 bp sequencing at Novogene (Beijing, China).
A total of 6.0 Gb raw reads were generated by next-generation sequencing on the Illumina platform. Before assembly, Illumina raw data were filtered into clean reads, and then undesirable reads were removed by fastp v. 0.21 [23], with the following parameters “–q 15 –u 40 –5 -–x –w 40 –f 10 –F 10” [23]. This filtering step was performed to remove the reads with adaptors, the reads showing a quality score below 20 (Q < 20), containing a percentage of uncalled based (“N” characters) equal or greater than 10% and the duplicated sequences. After removing low quality sequences, the 5.67 Gb clean Raw Data of R. zhenhaiensis and 5.05 Gb of R. longicrus were harvested. The clean reads de novo assemblies were conducted in Geneious 10.1.2 using the mitogenome of R. dybowskii (GenBank no. KF898355) as a reference map [24], and aligned contigs (≥80% similarity and an average 170 X coverage) were ordered according to the reference genome. The assembled contig identified as mitogenome was manually examined for repeats at the beginning and end of the sequence to infer circularity.

2.3. Sequence Assembly and Annotation

The mitogenome was first annotated with MITOS [25]. The PCGs and rRNA genes were determined by NCBI open reading frame finder implemented at the NCBI website with the vertebrate mitochondrial genetic code, and then manually corrected by comparison with the available sequences of closely related Rana species downloaded from GenBank using ClustalW in MEGA X [26]. The, tRNAscan-SE [27], and ARWEN [28] were used to confirm tRNA and rRNA annotation results. All tRNA genes were identified by their cloverleaf secondary structure using tRNA-scan SE or determined by comparison with the homologous sequences [27]. The graphical map of the mitogenome map was conducted using CGView Server online software [29].
The software of MEGA X was used to calculate the number of variable sites, the parsimony informative sites, the singleton, and the average uncorrected pairwise distances for 13 protein-coding genes of Rana [26]. Codon usage was estimated using DnaSP 5.1 [30]. Nucleotide composition and the relative synonymous codon usage (RSCU) were calculated with MEGA X [26]. The rates of non-synonymous substitutions (Ka, π modified), synonymous substitutions (Ks, π modified), the effective number of codons (ENC) and the codon bias index (CBI) for each protein-coding gene were determined with DnaSP 6.0 [31]. The value of nucleotide composition skewness was measured using the following formulas: GC-skew = (G − C)/(G + C) and AT-skew = (A − T)/(A + T) [32,33]. The tandem repeats were searched in the CR using the Tandem Repeats Finder program (https://tandem.bu.edu/trf/trf.html, accessed on 18 November 2021) [34].

2.4. Molecular Phylogenetic Analysis

We constructed the phylogenetic topology of 18 Rana species using 13 PCGs, 12S and 16S with two species (Babina subaspera GenBank no. NC_02287 and Pelophylax nigromaculatus KT878718) as outgroups. Phylogenetic analysis was performed using Bayesian Inference (BI). To determine the optimal partitioning of the data, the best-fit partitioning scheme and the most appropriate nucleotide evolution model for each partition were implemented in PartitionFinder 2, with greedy algorithm and Akaike Information Criterion (AICc) criterion [35]. BI method was performed using MrBayes 3.1.2 [36]. Four Markov Chains Monte Carlo (MCMC) chains were run for 1.0 × 10⁶ generations. Two independent runs were performed to confirm consistent approximation of the posterior parameter distributions. Stationarity was reached when the average standard deviation of split frequencies was below 0.01. The convergence of MCMC runs and effective sample sizes (ESS > 200) were checked by plotting the log-likelihood scores against the generation times using the program TRACER 1.6 (http://beast.bio.ed.ac.uk/Tracer accessed on 18 November 2021). The first 25% of sampled trees and estimated parameters were discarded as burn-in. The remaining trees were used to calculate consensus tree and Bayesian posterior probabilities.

2.5. Divergence Times Estimates

Divergence times were estimated using BEAST 1.8.4 [37]. The following parameters were used: GTR + I + G substitution model, relaxed log-normal molecular clock model and a Yule process for tree prior. Two calibration points were used for time calibration. The first calibration point, representing the split between Eurasian and American species, was set as 31.2 ± 8.1 Ma [2,38]. The second calibration point was a constraint of 15.0 Ma with 2.5% and 97.5% quantiles of 15.2 and 23.6 Ma for the most recent common ancestor of the R. catesbeiana group [2,13,39]. We performed two independent runs with a MCMC chains of 2 × 10⁸ generations, and trees were sampled every 1000 generations. The first 25% of the generations were discarded as burn-in. Convergence of the chains was determined with TRACER ver. 1.7.1 [40], with target ESS values more than 200 for all parameters. The tree information was annotated and visualized by FigTree v. 1.4.4 (http://tree.bio.ed.ac.uk/software/figtree/, accessed on 24 October 2021).

2.6. Mitogenomic Rearrangements Analysis

Multiple sequence alignment of the Rana mitogenome sequences was performed to verify the gene order of the mitochondrial genome. We reconstructed the ancestral states of gene rearrangements. The rearrangements patterns were categorized into three types (result 3.4). Ancestral discrete characteristics were reconstructed in a time-calibrated MCMC tree using the “ace” function in the “ape” package [41]. The parameters of the models were estimated using the ML method [42]. The final states were plotted in the time-calibrated MCMC tree using the “phytools” package [43].

3. Results and Discussion

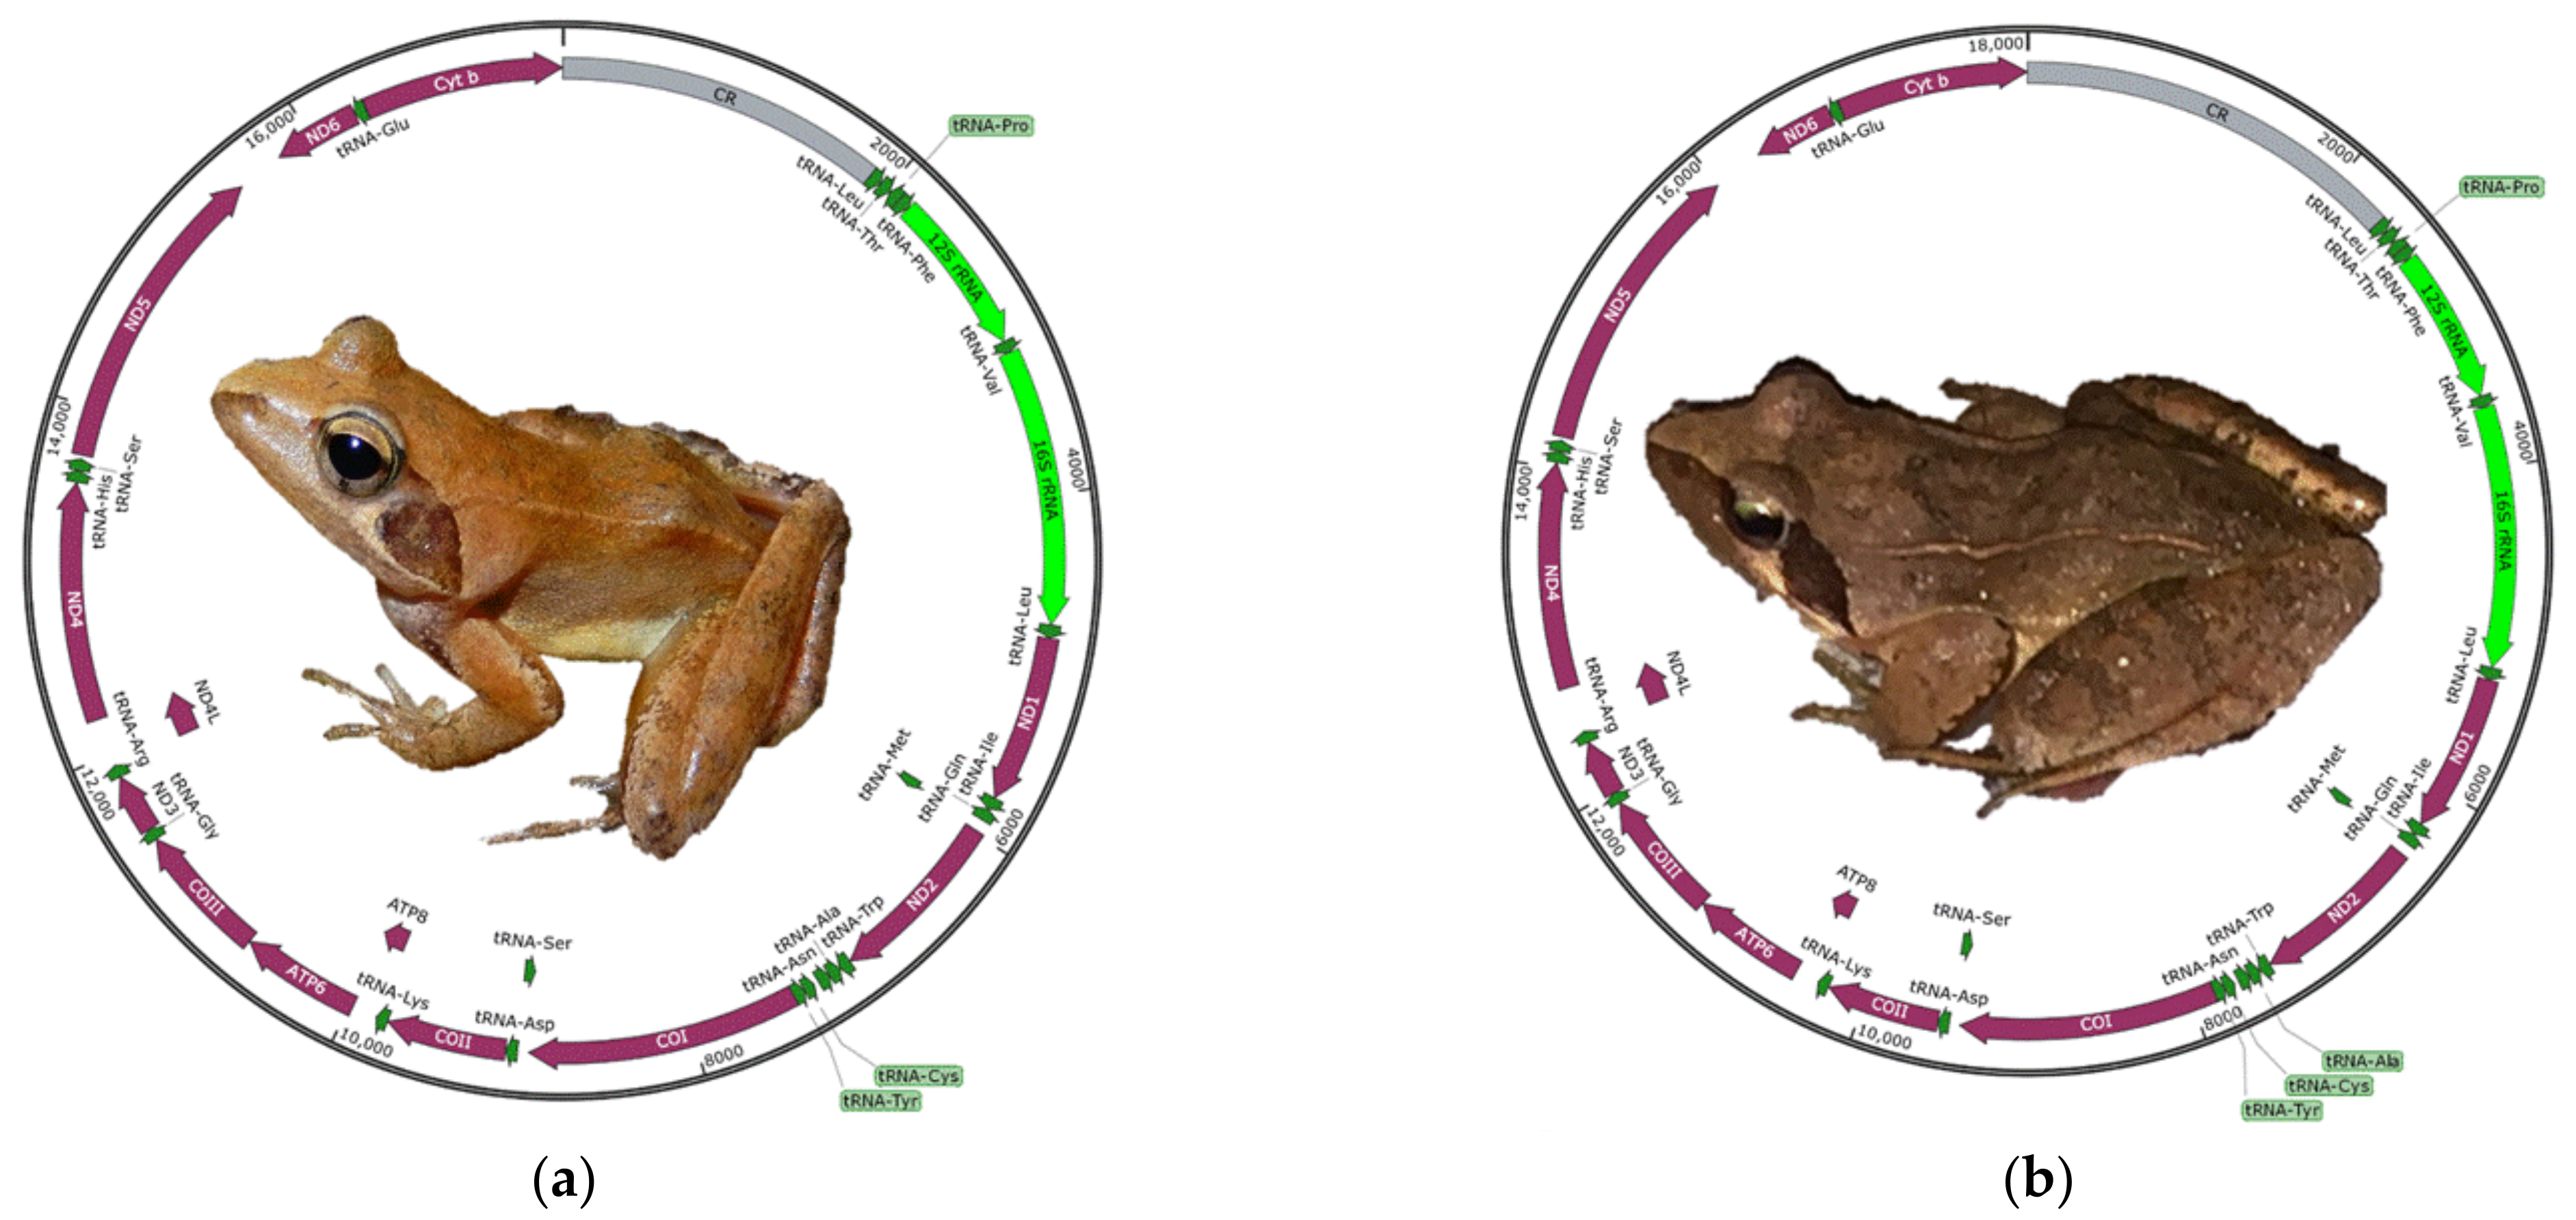
3.1. General Characteristics of the Mitogenome

The complete mitogenome of R. longicrus and R. zhenhaiensis was 17,502 bp and 18,006 bp in length, respectively. They carried the typical composition, including 37 genes (13 PCGs, two rRNAs, and 22 tRNAs) and the control region (Figure 1). Length differences were primarily the result of variation in control region. The overall base composition of the two Rana species in descending order was as follows: 29.8% C, 27.7% T, 27.3% A, and 15.1% G for R. longicrus; 29.9% C, 27.6% T, 27.4% A, and 15.0% G for R. zhenhaiensis. The average length of mitogenome in Rana was 18,401 bp, ranging from 16,061 bp (R. temporaria) to 22,255 bp (R. kunyuensis). The mitogenomes of Rana species are consistently biased towards AT rich, with an A + T% range from 55.7% (R. pyrenaica) to 60.6% (R. kunyuensis).

3.2. Protein-Coding Genes and the Codon Usage

Relative synonymous codon usage (RSCU) values for the 13 PCGs were summarized in Table 2. The 13 most frequently used amino acid was IleAUU, which accounts for 4.56% of the usage, and the least was ArgCGG (0.17%). To further study the codon usage bias of Rana, the correlation between ENC (effective codon number), CBI (codon bias index), G + C content of all codons (G + Cc), and G + C content of the third codon position (G + C3s) were analyzed. We found a significant negative correlation between CBI and ENC (R2 = 0.71; p < 0.01). However, there was no correlation between the other pairs (Figure 2).
The total length of the protein-coding genes in each species was 11,211 bp after removing termination codons and indels. The length of 13 PCGs ranged from 159 bp (ATP8) to 1740 bp (ND5). The overall AT-skew and GC-skew of the 13 PCGs were negative except that the AT-skew of COII and ATP8 and the GC-skew of ND6 were positive (Table 3). The use of start codons for 13 PCGs were quite common. Four start codons (ATG, GTG, ATC and ATA) were detected in 13 PCGs. The most common start codon was ATG, which accounts for 70.94% of the start codons, followed by GTG (16.67%) (Figure 3). However, the start codon is not determined in ND1 in R. longicrus and R. zhenhaiensis. Four types of stop codons were complete stop codons (TAA, TAG, AGA, and AGG), and the other type was incomplete stop codons (T--) (Figure 3). The incomplete stop codons were the most common stop codon, which was used by 10 genes (ND1, ND2, COII, ATP8, ATP6, COIII, ND3, ND4, ND5, Cyt b).
Comparison of PCGs provide a better understanding of the evolutionary pattern of molecular evolution. The variable positions in each gene ranged from 35.50% (COIII) to 54.09% (ATP8), and the parsimony informative sites ranged from 30.27% (COIII) to 47.41% (ND5). The average uncorrected pairwise distances showed the heterogeneity of the evolutionary rate in each gene. The COI (0.02), COII (0.05), and COIII (0.05) had slowly evolutionary rate, whereas the gene of ATP8 (0.21) had the fastest rate (Table 3).
To further understand the evolutionary patterns among the 13 protein-coding genes, Ka/Ks was calculated for each protein-coding gene, respectively. The Ka/Ks ratio values of 13 PCGs were <1, which suggested purifying selection of these functional genes. The gene of COI (0.02) had the slowest evolution rates, and was then followed by COIII (0.04) and COII (0.04). The gene of ATP8 (0.18) had the fastest evolutionary rates and was then followed by ND3 (0.17), ND4L (0.15), and ND6 (0.14) (Table 3).

3.3. Transfer RNA, Ribosomal RNA Genes and Control Region

The mitogenome of R. longicrus and R. zhenhaiensis includes 22 tRNA genes, with the length ranging from 65 to 73 bp. The majority of tRNAs exhibit a secondary structure, usually a cloverleaf shape, with alternating double-helix stems and single-stranded nucleotides. However, tRNASer(AGY) absented the dihydrouridine (DHU) arm.
Two ribosomal RNAs (12S rRNA and 16S rRNA) were identified on the H-strand. These two genes were separated by the gene of tRNAVal. The length of 12S rRNA and 16S rRNA were 931 bp (A+T = 53.38%) and 1,577bp (A+T = 57.36%) for R. longicrus, 931bp (A+T = 53.71%) and 1,576bp (A+T = 57.48%) for R. zhenhaiensis.
The control region is an important non-coding region in the mitogenome. It is located between Cyt b and tRNALeu(CUN), which spans 1,879 bp and 2,346 bp with A + T content of 61.6% and 59.3%, respectively. In R. zhenhaiensis, only one tandem repeats sequence of motif-1: 5′-TATGTTTAATAATCATTAATCTATCTGGATACTATCTC-3′ (38 nucleotides with 5 tandem repeats) was found. In R. longicrus, two tandem repeats were found, the motif-1 had 38 nucleotides with 4 tandem repeats, and the motif-2: 5′-TATGTTTAATAATCATTAACCTATCTAAGTACTATACCTA-3′ had 40 nucleotides with 2 tandem repeats).

3.4. Phylogenetic Relationships

We conducted a phylogenetic analysis of the mitogenomes of Rana species by using BI methods, estimating the phylogenetic tree using nucleotide sequences of 13 PCGs, 12S and 16S. All of the nodes exhibited high posterior probability values (Figure 4). In the phylogenetic tree, there were two major clades among Rana. The Clade A was consisted of three species, with R. sylvatica forms the sister group of two frogs (R. catesbeiana and R. okaloosae). The Clade B was consisted of the remaining species. The species of R. longicrus and R. zhenhaiensis formed a clade, which was a sister group to R. omeimontis and R. chaochiaoensis. Our analyses resolved two geographic lineages of Rana: Clade A (North America) was the sister group of Clade B (East Asia). The phylogeny of Rana reconstructed in our study was very similar to previous studies [2,44]. The main conflict involved the relationships among three species (R.chensinensis, R. kukunoris and R. huanrensis). Yuan et al. (2016) revealed the relationship of ((R.chensinensis, R. huanrensis), R. kukunoris) with relative low nodal support using sequences of six nuclear and three mitochondrial loci (total of 7,250 bp) [2]. However, this study supported the relationship of ((R.chensinensis, R. kukunoris), R. huanrensis) with high nodal support value, which was in agreement with the result of Yang et al. (2018) using two rRNAs and 13 PCGs [14]. Due to limited data on Europe and Central Asia groups in this study, we cannot provide more effective results to resolve detailed phylogenetic problems. The newly sequenced mitogenomes will provide useful information for better understanding the evolutionary history of genus Rana and will contribute to further taxonomic research within Ranidae.

3.5. Divergence-Time Estimation

The high ESS (effective sample size) value (>200) was identified for all parameters in the BEAST analysis to estimate the divergence time of Rana species (Figure 5). Dating analyses suggests that the most recent common ancestor (TMRCA) of Rana dates back to at 28.17 million years ago (Mya) [mean value; 95% of the highest posterior density (HPD), 23.07–34.69 Mya] (95% HPD, Mya) and dated to Oligocene (Figure 5), roughly consistent with the previous study [2]. It may be affected by the collision of India with Eurasia between 35–20 Ma [38]. TMRCA of Clade A and B were estimated at 22.00 Mya (95% HPD, 13.71–30.43 Mya) and 23.16 Mya (95% HPD, 19.19–328.11 Mya), respectively. Since 16.09 Mya, the diversification rate within Clade B began to increase during the Miocene (Figure 5), which indicated that the ancestral Rana fast dispersal across East Asia [38]. This study inferred the separation of R. dybowskii and R. uenoi dated at 8.13 Mya (95% HPD, 5.41–11.11 Mya) during the Middle and Late Miocene, which was consistent with the previous study [13], and was similar to the species diversification pattern in Hyla [45]. The Early Miocene diversification of R. zhenhaiensis and R. longicrus was formed by volcanism in Sikhote-Alin and Sakhalin in mid-Miocene-Pliocen [46]. We suggest that climate fluctuation and environmental change may have played an essential role in the species diversification in Rana.

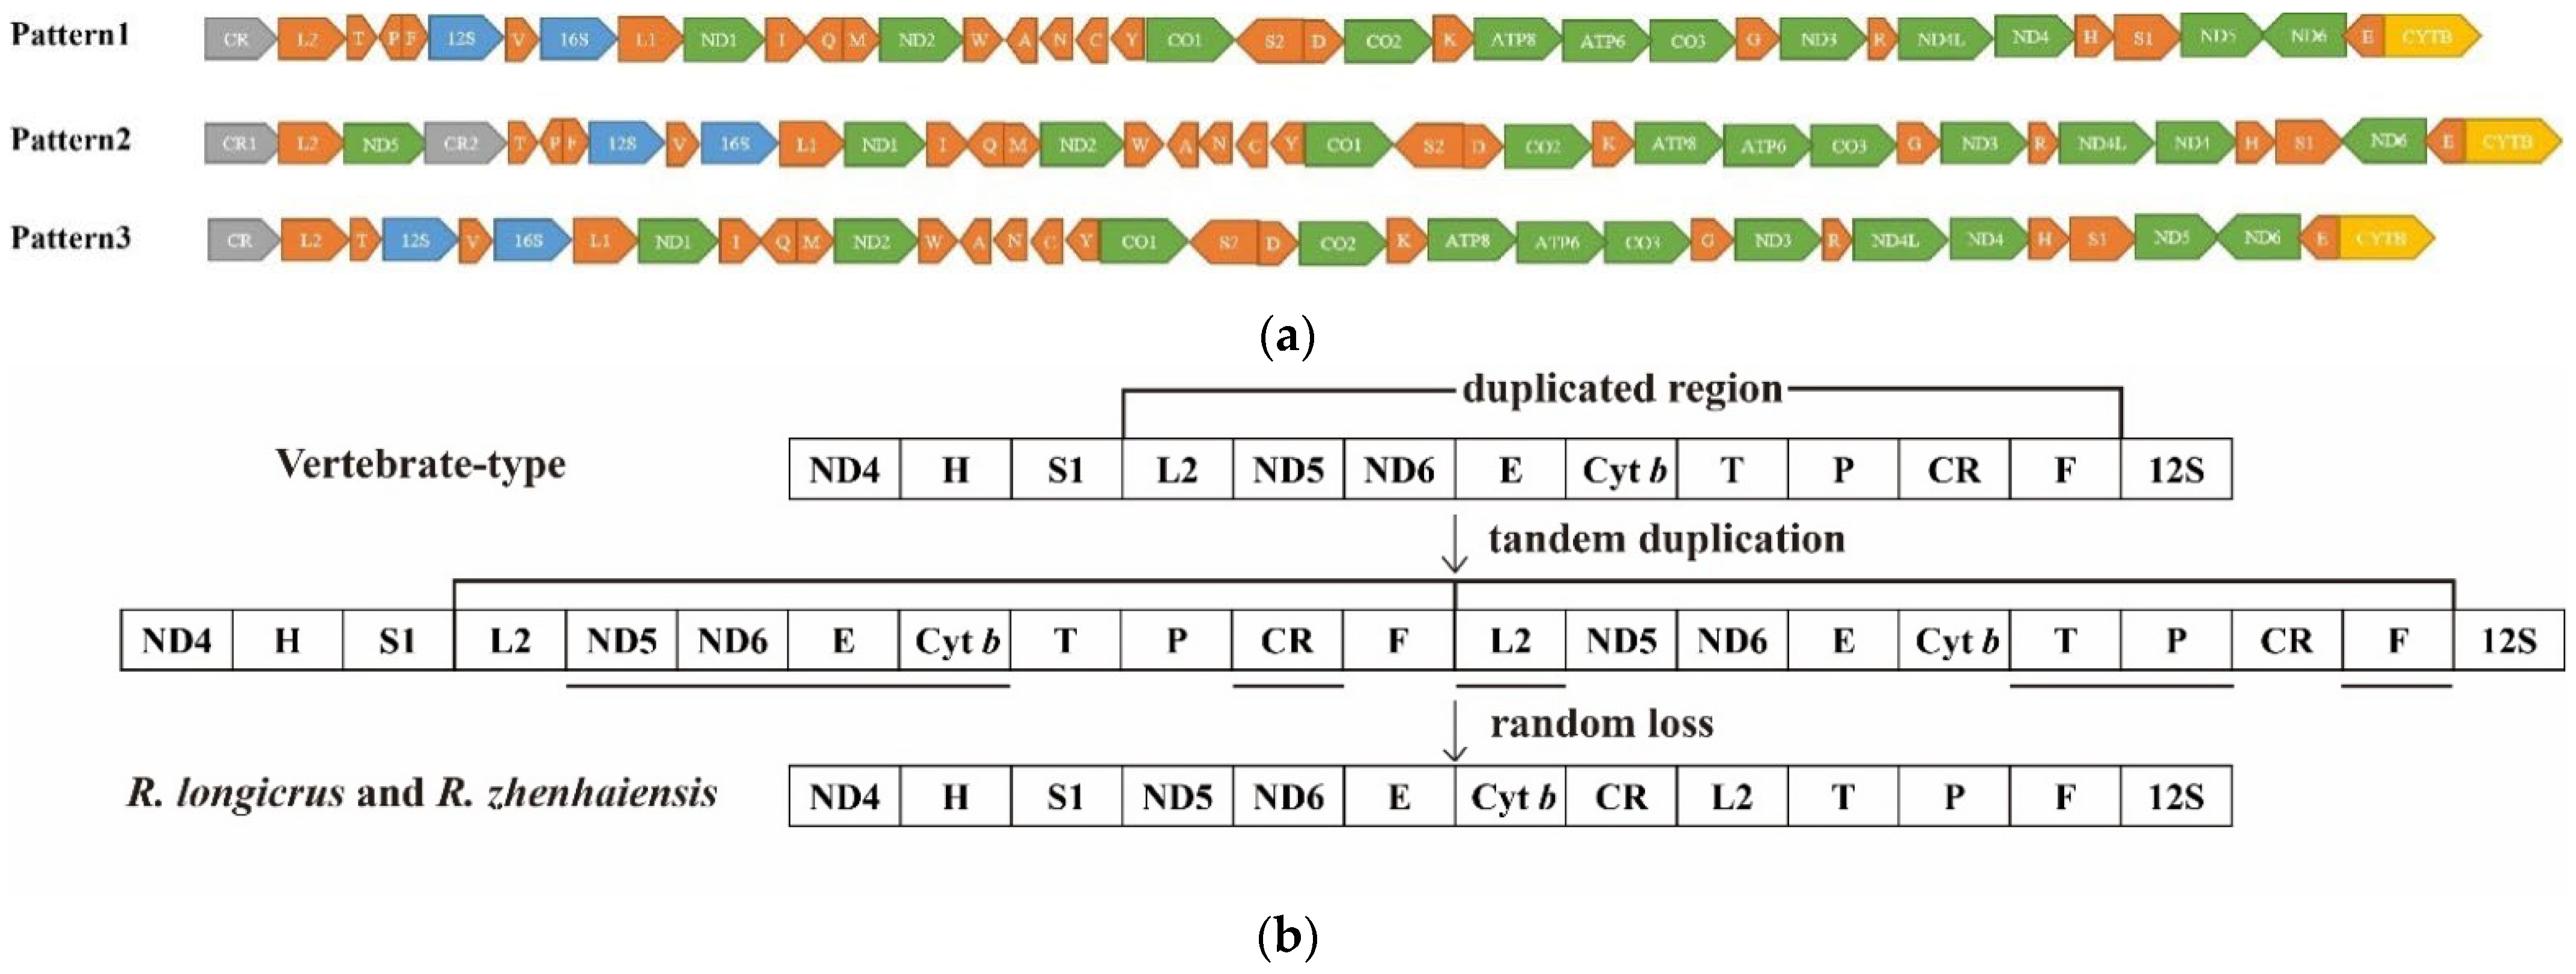
3.6. Mitogenomic Rearrangements

Based on the comparison of genome organization, we detected three kind of gene arrangements. Our results showed that Pattern 1 was the most common type in Rana mitogenomes (Figure 6). Reconstructions of mitogenomic rearrangements pattern indicated that the ancestor of Rana consisted of Pattern 1. The R. kunyuensis and R. amurensis species have the same rearrangement, indicating that they have close relationships. The results showed that the mitochondrial gene arrangement was not related to species diversification, and several independent shifts happened in evolutionary history.
All rearrangements occurred between ND4 and tRNAThr region (Figure 7). Our results showed that Pattern 1 (the typical Neobatrachian-type arrangement) was the most common type, and Pattern 2 was shared by R. kunyuensis and R. amurensis. Compared with Pattern 1, one additional D-loop region was inserted into the upstream of tRNAThr, and the ND5 was translocated from the typical tRNASer(AGY) downstream to the tRNALeuCUN downstream. Pattern 3 was only discovered in R. pyrenaica, in which tRNAPro-tRNAPhe was not located between tRNAThr and 12S.
The gene arrangement of vertebrate mitogenome is usually conservative, and gene recombination is relatively rare or random [49]. However, in Neobatrachian, tRNA genes were translocated from typical positions, and these tRNA genes formed a cluster upstream of the 12S rRNA gene [50]. Currently, the duplication and random loss (TDRL) model can be used to explain most of the animal mitogenome reorganization [51]. In this model, a part of the entire genome was duplicated accidentally due to replication errors (either slipped strand mispairing or inaccurate termination). Then one of the duplicates (or CR) was converted into a pseudogene and subsequently excised from the genome through the accumulation of natural mutations [52]. In this study, R. longicrus and R. zhenhaiensis mitogenome possessed the same gene order as Neobatrachian. Nine genes (between tRNALeu (CUN) and tRNAPhe) were tandem duplicated, forming two identical gene clusters. Then, after the random loss of nine genes, the gene cluster produced by tandem duplication formed the currently known type of mitochondrial gene rearrangement Figure 7b. This explanation was confirmed by previous studies [53,54].
Various types of mitogenome recombination have occurred in Ranidae species, which is also reflected in Rana genus [49]. In this study, we found a total of three kind of gene arrangement patterns in Rana species, which was consistent with the various types of mitogenome recombination in Ranidae species [55]. The mitogenome of R. amurensis and R. kunyuensis possessed two duplicate D-loop regions and this phenomenon was also found in other frogs [53]. The duplicated D-loop regions were similar to the original D-loop structure, which will result from homologous recombination between paralogous D-loop regions [44]. In general, the observed pattern is largely consistent with the TDRL model, the most general explanation for mitogenomic reorganization [56]. Subsequently, gene transfers via retrotransposition may be a pattern of gene rearrangement in animal mtDNAs [55]. We found mitogenome rearrangement in genus Rana, but it remains to be seen whether similar or new rearrangement patterns will occur in un-sequenced Rana.

4. Conclusions

In this study, we sequenced and annotated the mitogenome of R. longicrus and R. zhenhaiensis using the Illumina Novaseq 6000 platform for PE 2 × 150 bp sequencing. Circular mitogenomes of Rana displayed high size variation, with a mean length of 18,534 bp, ranging from 16,961 to 22,255 bp. The length of the mitogenome of R. longicrus was smaller than that of most Rana species. Differences in the length of the complete mitogenome are mainly caused by the control region. The mitogenome encoded a control region and a typical set of 37 genes containing 2 rRNA genes, 13 protein-coding genes, and 22 tRNA genes. The genome composition and characteristics were analyzed, RSCU and AT-skew values of the PCGs were calculated. In general, negative AT-skew and negative GC-skew are found in Rana mitogenomes, implying the specific bias toward T and C in nucleotide composition. The average uncorrected pairwise distances showed that the COI may be the most conserved protein coding gene, and ATP8 was the least conserved. The most common start codon was ATG and the incomplete stop codon was most common as a stop codon. To verify the gene order of mitogenome, multiple sequence alignment of the Rana mitogenome sequences was performed. There were three kinds of gene arrangement patterns in Rana. The gene recombination mainly occurred at the control region, gene of ND5 and tRNA. The results showed that the Pattern 1 was the most common type in Rana mitogenomes, the mitochondrial gene arrangement was not related to species diversification, and several independent shifts happened in evolutionary history. Climate fluctuation and environmental change may have played an essential role in the species diversification in Rana. The molecular data obtained in this study are valuable for research on the taxonomy, population genetics, and evolution of frogs in the genera Rana. In the future, sequencing more mitogenomes from various taxonomic levels will provide useful information for better understanding the evolutionary history and will contribute to further taxonomic research within Ranidae.

Author Contributions

Conceptualization, C.H., Q.C., and W.C.; methodology, W.C. and W.Q.; software, R.Q., K.M., and S.Y.; validation, C.H. and Q.C.; formal analysis, C.H.; investigation, J.D.; resources, J.D.; data curation, W.C.; writing—original draft preparation, C.H. and W.L.; writing—review and editing, C.H. and W.C.; visualization, Q.C.; supervision, Q.C.; project administration, Q.C. and W.C.; funding acquisition, Q.C. and W.C. All authors have read and agreed to the published version of the manuscript.

Funding

This research was funded by the Program of Nature Science Fund of Jiangsu Province, grant number BK20181076, Natural Science Research of Jiangsu Higher Education Institutions of China, grant number 20KJD180004, and Jiangsu Open Laboratory of Major Scientific Instrument and Equipment, Nanjing Normal University, Nanjing 210023, China.

Institutional Review Board Statement

The study was approved by the Nanjing Normal University’s Animal Care and Use Committee (protocol code #IACUC-20210201; 10 February 2021).

Informed Consent Statement

Not applicable.

Data Availability Statement

The genome sequence data that support the findings of this study are openly available in GenBank of NCBI at https://www.ncbi.nlm.nih.gov/ under the accession no. OL681879 and OL681880. The raw sequencing data have been deposited in GenBank associated BioProject, SRA, and Bio-Sample numbers are PRJNA785017, SUB10733125, SAMN23525929, and PRJNA784715, SUB10728085, SAMN23498843, respectively.

Conflicts of Interest

The authors declare no conflict of interest.

References

  1. Frost, D.R. Amphibian Species of the World: An Online Reference, Version 6.0. 2019. Available online: http://research.amnh.org/vz/herpetology/amphibia (accessed on 24 October 2021).
  2. Yuan, Z.; Zhou, W.; Chen, X.; Poyarkov Jr, N.A.; Chen, H.; Jang-Liaw, N.; Chou, W.; Matzke, N.J.; Iizuka, K.; Min, M. Spatiotemporal diversification of the true frogs (genus Rana): A historical framework for a widely studied group of model organisms. Syst. Biol. 2016, 65, 824–842. [Google Scholar] [CrossRef] [PubMed] [Green Version]
  3. Jiang, J.; Zhou, K. Phylogenetic relationships among Chinese Ranids inferred from sequence data set of 12S and 16S rDNA. Herpetol. J. 2005, 15, 1–8. [Google Scholar]
  4. Wang, C.; Qian, L.; Zhang, C.; Guo, W.; Pan, T.; Wu, J.; Wang, H.; Zhang, B. A new species of Rana from the Dabie Mountains in eastern China (Anura, Ranidae). ZooKeys 2017, 724, 135–153. [Google Scholar] [CrossRef] [PubMed] [Green Version]
  5. Amiri, N.; Vaissi, S.; Aghamir, F.; Saberi-Pirooz, R.; Rödder, D.; Ebrahimi, E.; Ahmadzadeh, F. Tracking climate change in the spatial distribution pattern and the phylogeographic structure of Hyrcanian wood frog, Rana pseudodalmatina (Anura: Ranidae). J. Zool. Syst. Evol. Res. 2021, 59, 1604–1619. [Google Scholar] [CrossRef]
  6. Zhou, Y.; Wang, S.; Zhu, H.; Li, P.; Yang, B.; Ma, J. Phylogeny and biogeography of South Chinese brown frogs (Ranidae, Anura). PloS ONE 2017, 12, e0175113. [Google Scholar] [CrossRef]
  7. Schoch, C.L.; Ciufo, S.; Domrachev, M.; Hotton, C.L.; Kannan, S.; Khovanskaya, R.; Leipe, D.; Mcveigh, R.; O’Neill, K.; Robbertse, B. NCBI Taxonomy: A comprehensive update on curation, resources and tools. Database 2020, 2020, baaa062. [Google Scholar] [CrossRef] [PubMed]
  8. Wang, K.; Ren, J.; Chen, H.; Lyu, Z.; Guo, X.; Jiang, K.; Chen, J.; Li, J.; Guo, P.; Wang, Y. The updated checklists of amphibians and reptiles of China. Biodivers. Sci. 2020, 28, 189–218, (In Chinese with English Abstract). [Google Scholar]
  9. Che, J.; Pang, J.; Zhao, H.; Wu, G.; Zhao, E.; Zhang, Y. Phylogeny of Raninae (Anura: Ranidae) inferred from mitochondrial and nuclear sequences. Mol. Phylogenetics Evol. 2007, 43, 1–13. [Google Scholar] [CrossRef]
  10. Zhao, H.; Yang, J.; Wang, C.; Li, P.; Murphy, R.W.; Che, J.; Yuan, Z. A new species of the genus Rana from Henan, central China (Anura, Ranidae). ZooKeys 2017, 694, 95–108. [Google Scholar] [CrossRef] [Green Version]
  11. Wan, H.; Lyu, Z.; Qi, S.; Zhao, J.; Li, P.; Wang, Y. A new species of the Rana japonica group (Anura, Ranidae, Rana) from China, with a taxonomic proposal for the R. johnsi group. ZooKeys 2020, 942, 141–158. [Google Scholar] [CrossRef]
  12. Wu, Y.; Shi, S.; Zhang, H.; Chen, W.; Cai, B.; Hoang, V.; Wu, J.; Wang, B. A new species of the genus Rana sensu lato Linnaeus, 1758 (Anura, Ranidae) from Wuyi Mountain, Fujian Province, China. ZooKeys 2021, 1065, 101–124. [Google Scholar] [CrossRef] [PubMed]
  13. Yang, B.; Zhou, Y.; Min, M.; Matsui, M.; Dong, B.; Li, P.; Fong, J.J. Diversity and phylogeography of Northeast Asian brown frogs allied to Rana dybowskii (Anura, Ranidae). Mol. Phylogenet. Evol. 2017, 112, 148–157. [Google Scholar] [CrossRef] [PubMed]
  14. Yang, J.; Yu, J.; Liu, J.; Zhou, M.; Li, B.; Ouyang, B. Three new Ranidae mitogenomes and the evolution of mitochondrial gene rearrangements among Ranidae species. Asian Herpetol. Res. 2018, 9, 85–98. [Google Scholar]
  15. Ruokonen, M.; Kvist, L. Structure and evolution of the avian mitochondrial control region. Mol. Phylogenet. Evol. 2002, 23, 422–432. [Google Scholar] [CrossRef]
  16. Oliver, L.A.; Prendini, E.; Kraus, F.; Raxworthy, C.J. Systematics and biogeography of the Hylarana frog (Anura: Ranidae) radiation across tropical Australasia, Southeast Asia, and Africa. Mol. Phylogenet. Evol. 2015, 90, 176–192. [Google Scholar] [CrossRef] [Green Version]
  17. Du, Z.; Hasegawa, H.; Cooley, J.R.; Simon, C.; Yoshimura, J.; Cai, W.; Sota, T.; Li, H. Mitochondrial genomics reveals shared phylogeographic patterns and demographic history among three periodical cicada species groups. Mol. Biol. Evol. 2019, 36, 1187–1200. [Google Scholar] [CrossRef]
  18. Hu, Y.; Thapa, A.; Fan, H.; Ma, T.; Wu, Q.; Ma, S.; Zhang, D.; Wang, B.; Li, M.; Yan, L. Genomic evidence for two phylogenetic species and long-term population bottlenecks in red pandas. Sci. Adv. 2020, 6, eaax5751. [Google Scholar] [CrossRef] [Green Version]
  19. Li, Q.; Wei, S.J.; Tang, P.; Wu, Q.; Shi, M.; Sharkey, M.J.; Chen, X.X. Multiple lines of evidence from mitochondrial genomes resolve phylogenetic relationships of parasitic wasps in Braconidae. Genome Biol. Evol. 2016, 8, 2651–2662. [Google Scholar] [CrossRef] [Green Version]
  20. Pan, T.; Sun, Z.; Lai, X.; Orozcoterwengel, P.; Yan, P.; Wu, G.; Wang, H.; Zhu, W.; Wu, X.; Zhang, B. Hidden species diversity in Pachyhynobius: A multiple approaches species delimitation with mitogenomes. Mol. Phylogenet. Evol. 2019, 137, 138–145. [Google Scholar] [CrossRef]
  21. Lamelas, L.; Aleix-Mata, G.; Rovatsos, M.; Marchal, J.A.; Palomeque, T.; Lorite, P.; Sánchez, A. Complete mitochondrial genome of three species of the genus Microtus (Arvicolinae, Rodentia). Animals 2020, 10, 2130. [Google Scholar] [CrossRef]
  22. Choi, E.; Kim, S.H.; Lee, S.J.; Jo, E.; Kim, J.; Kim, J.H.; Parker, S.J.; Chi, Y.M.; Park, H. A first genome survey and genomic SSR marker analysis of Trematomus loennbergii Regan, 1913. Animals 2021, 11, 3186. [Google Scholar] [CrossRef] [PubMed]
  23. Chen, S.; Zhou, Y.; Chen, Y.; Gu, J. fastp: An ultra-fast all-in-one FASTQ preprocessor. Bioinformatics 2018, 34, 884–890. [Google Scholar] [CrossRef] [PubMed]
  24. Kearse, M.; Moir, R.; Wilson, A.; Stones-Havas, S.; Cheung, M.; Sturrock, S.; Buxton, S.; Cooper, A.; Markowitz, S.; Duran, C. Geneious Basic: An integrated and extendable desktop software platform for the organization and analysis of sequence data. Bioinformatics 2012, 28, 1647–1649. [Google Scholar] [CrossRef] [PubMed]
  25. Bernt, M.; Donath, A.; Jühling, F.; Externbrink, F.; Florentz, C.; Fritzsch, G.; Pütz, J.; Middendorf, M.; Stadler, P.F. MITOS: Improved de novo metazoan mitochondrial genome annotation. Mol. Phylogenet. Evol. 2013, 69, 313–319. [Google Scholar] [CrossRef] [PubMed]
  26. Kumar, S.; Stecher, G.; Li, M.; Knyaz, C.; Tamura, K. MEGA X: Molecular evolutionary genetics analysis across computing platforms. Mol. Biol. Evol. 2018, 35, 1547–1549. [Google Scholar] [CrossRef] [PubMed]
  27. Lowe, T.M.; Chan, P.P. tRNAscan-SE On-line: Integrating search and context for analysis of transfer RNA genes. Nucleic Acids Res. 2016, 44, W54–W57. [Google Scholar] [CrossRef]
  28. Laslett, D.; Canbäck, B. ARWEN: A program to detect tRNA genes in metazoan mitochondrial nucleotide sequences. Bioinformatics 2008, 24, 172–175. [Google Scholar] [CrossRef] [Green Version]
  29. Stothard, P.; Wishart, D.S. Circular genome visualization and exploration using CGView. Bioinformatics 2005, 21, 537–539. [Google Scholar] [CrossRef] [Green Version]
  30. Librado, P.; Rozas, J. DnaSP v5: A software for comprehensive analysis of DNA polymorphism data. Bioinformatics 2009, 25, 1451. [Google Scholar] [CrossRef] [Green Version]
  31. Rozas, J.; Ferrer-Mata, A.; Sánchez-DelBarrio, J.C.; Guirao-Rico, S.; Librado, P.; Ramos-Onsins, S.E.; Sánchez-Gracia, A. DnaSP 6: DNA sequence polymorphism analysis of large data sets. Mol. Biol. Evol. 2017, 34, 3299–3302. [Google Scholar] [CrossRef]
  32. Lobry, J.R. Asymmetric substitution patterns in the two DNA strands of bacteria. Mol. Biol. Evol. 1996, 13, 660–665. [Google Scholar] [CrossRef] [PubMed] [Green Version]
  33. Perna, N.T.; Kocher, T.D. Patterns of nucleotide composition at fourfold degenerate sites of animal mitochondrial genomes. J. Mol. Evol. 1995, 41, 353–358. [Google Scholar] [CrossRef] [PubMed]
  34. Benson, G. Tandem repeats finder: A program to analyze DNA sequences. Nucleic Acids Res. 1999, 27, 573–580. [Google Scholar] [CrossRef] [PubMed] [Green Version]
  35. Lanfear, R.; Frandsen, P.B.; Wright, A.M.; Senfeld, T.; Calcott, B. PartitionFinder 2: New methods for selecting partitioned models of evolution for molecular and morphological phylogenetic analyses. Mol. Biol. Evol. 2017, 34, 772–773. [Google Scholar] [CrossRef] [Green Version]
  36. Ronquist, F.; Huelsenbeck, J.P. MrBayes 3: Bayesian phylogenetic inference under mixed models. Bioinformatics 2003, 19, 1572–1574. [Google Scholar] [CrossRef] [Green Version]
  37. Wang, J.; Li, Z.; Gao, H.; Liu, Z.; Teng, L. The complete mitochondrial genome of the Rana kukunoris (Anura: Ranidae) from Inner Mongolia, China. Mitochondrial Dna Part B 2020, 5, 586–587. [Google Scholar] [CrossRef] [Green Version]
  38. Bossuyt, F.; Brown, R.M.; Hillis, D.M.; Cannatella, D.C.; Milinkovitch, M.C. Phylogeny and biogeography of a cosmopolitan frog radiation: Late Cretaceous diversification resulted in continent-scale endemism in the family Ranidae. Syst. Biol. 2006, 55, 579–594. [Google Scholar] [CrossRef]
  39. Voorhies, M.R.; Holman, J.A.; Xiang, X.X. The Hottell Ranch rhino quarries (basal Ogallala: Medial Barstovian), Banner County, Nebraska. Part I: Geological setting, faunal lists, lower vertebrates. Contrib. Geol. Univ. Wyo. 1987, 25, 55–69. [Google Scholar]
  40. Rambaut, A.; Drummond, A.J.; Xie, D.; Baele, G.; Suchard, M.A. Posterior summarization in Bayesian phylogenetics using Tracer 1.7. Syst. Biol. 2018, 67, 901–904. [Google Scholar] [CrossRef] [Green Version]
  41. Paradis, E.; Claude, J.; Strimmer, K. APE: Analyses of phylogenetics and evolution in R language. Bioinformatics 2004, 20, 289–290. [Google Scholar] [CrossRef] [Green Version]
  42. Pagel, M. Detecting correlated evolution on phylogenies: A general method for the comparative analysis of discrete characters. Proc. R. Soc. Lond. Ser. B Biol. Sci. 1994, 255, 37–45. [Google Scholar]
  43. Revell, L.J. phytools: An R package for phylogenetic comparative biology (and other things). Methods Ecol Evol. 2012, 3, 217–223. [Google Scholar] [CrossRef]
  44. Jiang, L.; Zhang, M.; Deng, L.; Xu, Z.; Shi, H.; Jia, X.; Lai, Z.; Ruan, Q.; Chen, W. Characteristics of the mitochondrial genome of Rana omeimontis and related species in Ranidae: Gene rearrangements and phylogenetic relationships. Ecol. Evol. 2020, 10, 12817–12837. [Google Scholar] [CrossRef] [PubMed]
  45. Yan, P.; Pan, T.; Wu, G.; Kang, X.; Ali, I.; Zhou, W.; Li, J.; Wu, X.; Zhang, B. Species delimitation and evolutionary history of tree frogs in the Hyla chinensis group (Hylidae, Amphibian). Front. Ecol. Evol. 2020, 8, 234. [Google Scholar] [CrossRef]
  46. Okamura, S.; Arculus, R.J.; Martynov, Y.A. Cenozoic magmatism of the North-Eastern Eurasian margin: The role of lithosphere versus asthenosphere. J. Petrol. 2005, 46, 221–253. [Google Scholar] [CrossRef] [Green Version]
  47. Zachos, J.; Pagani, M.; Sloan, L.; Thomas, E.; Billups, K. Trends, rhythms, and aberrations in global climate 65 Ma to present. Science 2001, 292, 686–693. [Google Scholar] [CrossRef] [PubMed]
  48. Zachos, J.C.; Dickens, G.R.; Zeebe, R.E. An early Cenozoic perspective on greenhouse warming and carbon-cycle dynamics. Nature 2008, 451, 279–283. [Google Scholar] [CrossRef] [PubMed]
  49. Irisarri, I.; San Mauro, D.; Abascal, F.; Ohler, A.; Vences, M.; Zardoya, R. The origin of modern frogs (Neobatrachia) was accompanied by acceleration in mitochondrial and nuclear substitution rates. Bmc Genom. 2012, 13, 626. [Google Scholar] [CrossRef] [Green Version]
  50. Igawa, T.; Kurabayashi, A.; Usuki, C.; Fujii, T.; Sumida, M. Complete mitochondrial genomes of three neobatrachian anurans: A case study of divergence time estimation using different data and calibration settings. Gene 2008, 407, 116–129. [Google Scholar] [CrossRef]
  51. Kurabayashi, A.; Sumida, M.; Yonekawa, H.; Glaw, F.; Vences, M.; Hasegawa, M. Phylogeny, recombination, and mechanisms of stepwise mitochondrial genome reorganization in mantellid frogs from Madagascar. Mol. Biol. Evol. 2008, 25, 874–891. [Google Scholar] [CrossRef] [Green Version]
  52. Dowton, M.; Castro, L.R.; Campbell, S.L.; Bargon, S.D.; Austin, A.D. Frequent mitochondrial gene rearrangements at the hymenopteran nad3–nad5 junction. J. Mol. Evol. 2003, 56, 517–526. [Google Scholar] [CrossRef] [PubMed]
  53. Kurabayashi, A.; Yoshikawa, N.; Sato, N.; Hayashi, Y.; Oumi, S.; Fujii, T.; Sumida, M. Complete mitochondrial DNA sequence of the endangered frog Odorrana ishikawae (family Ranidae) and unexpected diversity of mt gene arrangements in ranids. Mol. Phylogenet. Evol. 2010, 56, 543–553. [Google Scholar] [CrossRef] [PubMed]
  54. Sumida, M.; Kanamori, Y.; Kaneda, H.; Kato, Y.; Nishioka, M.; Hasegawa, M.; Yonekawa, H. Complete nucleotide sequence and gene rearrangement of the mitochondrial genome of the Japanese pond frog Rana nigromaculata. Genes Genet. Syst. 2001, 76, 311–325. [Google Scholar] [CrossRef] [PubMed] [Green Version]
  55. Zhang, J.; Miao, G.; Hu, S.; Sun, Q.; Ding, H.; Ji, Z.; Guo, P.; Yan, S.; Wang, C.; Kan, X. Quantification and evolution of mitochondrial genome rearrangement in Amphibians. Bmc Ecol. Evol. 2021, 21, 19. [Google Scholar] [CrossRef]
  56. San Mauro, D.; Gower, D.J.; Zardoya, R.; Wilkinson, M. A hotspot of gene order rearrangement by tandem duplication and random loss in the vertebrate mitochondrial genome. Mol. Biol. Evol. 2006, 23, 227–234. [Google Scholar] [CrossRef]
Figure 1. Map of the mitogenome of (a) R. longicrus and (b) R. zhenhaiensis. Arrows indicate the orientation of gene transcription. PCGs are shown as purple arrows, rRNA genes as green arrows, tRNA genes as dark green arrows and control region as gray arrows. Ticks in the inner cycle indicate the sequence length.
Animals 12 01250 g001
Figure 2. Evaluation of codon bias in mitogenomes of 17 Species of Rana. ENC, effective codon number. CBI, codon bias index. G + Cc, the content of G + C at all locations of the codon. G + C3s, G + C content of the third codon position.
Animals 12 01250 g002
Figure 3. The usage of start (a) and stop (b) codons in the 13 mitochondrial protein-coding genes of Rana.
Animals 12 01250 g003
Figure 4. Phylogenetic tree using Bayesian inferences (BI) analyses based on mitochondrial genes (concatenated by 13 PCGs and 2 rRNAs). Posterior probabilities right to the nodes.
Animals 12 01250 g004
Figure 5. Time-calibrated phylogeny of Rana inferred from the complete mitogenomes. The symbol * indicates the calibration points. Horizontal blue bars represent 95% posterior density of the age on the node. The bottom axis is in million years ago (Mya). The climatic sequence of events including a global average δ18O curve (right-hand axis) derived from benthic foraminifera which mirrors the major global temperature trends [47,48].
Animals 12 01250 g005
Figure 6. Reconstruction of ancestral mitogenomic rearrangement of Rana. Pie diagrams on nodes indicate the relative probability for each pattern.
Animals 12 01250 g006
Figure 7. (a). Comparison of mitogenome arrangement of Rana. tRNAs are named using single-letter amino acid abbreviations. L1, L2, S1, and S2 represent tRNAs of Leu(UUR), Leu(CUN), Ser(AGY), and Ser(UCN), respectively. (b). A model for gene reorganization in the mtDNA genomes of R. longicrus and R. zhenhaiensis. After tandem duplication of a gene region is produced, multiple deletions of redundant genes occur. The gene order of R. longicrus and R. zhenhaiensis is the same as neobatrachians’ general one.
Animals 12 01250 g007
Table 1. Species used in this study.
SpeciesAbbreviationsLength(bp)GenBank
Rana zhenhaiensis *zhe18,006OL681880
Rana longicrus *lon17,502OL681879
Rana huanrensishua19,253KT588071
Rana amurensisamu0120,571MF370348
Rana amurensisamu0218,470KU343216
Rana kunyuensiskun22,255KF840516
Rana chensinensische18,808KF898356
Rana dybowskiidyb18,864KF898355
Rana omeimontisome20,120MK483118
Rana kukunoriskuk18,863KU246049
Rana chaochiaoensischa18,591KU246048
Rana draytoniidra17,805KP013110
Rana catesbeianacat0117,681KX686108
Rana catesbeianacat0217,682AB761267
Rana catesbeianacat0318,241KF049927
Rana sylvaticasyl17,343KP222281
Rana okaloosaeoka17,504KP013096
Rana pyrenaicapyr17,211KU720300
Rana temporariatem16,061MH536744
Rana uenoiuen17,370MW009067
Babina subasperaBsub18,525NC_022871
Pelophylax nigromaculatusPnig17,567KT878718
Sequenced mitogenomes in this study are noted by “*”.
Table 2. The usage of amino acid coding codon.
AACodonCountPercentage (%)RSCUAACodonCountPercentage (%)RSCU
Phe (F)UUU133.93.591.02Ala (A)GCA69.91.870.87
Phe (F)UUC128.53.440.98Ala (A)GCG13.40.360.17
Leu2 (L2)UUA119.83.211.15Tyr (Y)UAU55.81.490.98
Leu2 (L2)UUG25.60.690.25Tyr (Y)UAC58.41.561.02
Leu1 (L1)CUU135.23.621.3His (H)CAU31.60.850.64
Leu1 (L1)CUC158.64.251.52His (H)CAC66.91.791.36
Leu1 (L1)CUA143.83.851.38Gln (Q)CAA75.52.021.78
Leu1 (L1)CUG43.41.160.42Gln (Q)CAG9.30.250.22
Ile (I)AUU170.34.561.12Asn (N)AAU60.11.610.94
Ile (I)AUC134.53.600.88Asn (N)AAC67.61.811.06
Met (M)AUA115.23.091.42Lys (K)AAA70.71.891.74
Met (M)AUG471.260.58Lys (K)AAG10.80.290.26
Val (V)GUU57.41.541.17Asp (D)GAU26.40.710.72
Val (V)GUC52.51.411.07Asp (D)GAC46.61.251.28
Val (V)GUA61.51.651.25Glu (E)GAA68.61.841.56
Val (V)GUG25.40.680.52Glu (E)GAG19.50.520.44
Ser2 (S2)UCU63.21.691.43Cys (C)UGU12.80.340.82
Ser2 (S2)UCC75.92.031.71Cys (C)UGC18.30.491.18
Ser2 (S2)UCA66.61.781.5Trp (W)UGA87.82.351.63
Ser2 (S2)UCG9.10.240.21Trp (W)UGG19.80.530.37
Pro (P)CCU44.71.200.88Arg (R)CGU12.10.320.65
Pro (P)CCC88.22.361.73Arg (R)CGC22.60.611.23
Pro (P)CCA59.61.601.17Arg (R)CGA32.80.881.78
Pro (P)CCG11.10.300.22Arg (R)CGG6.20.170.34
Thr (T)ACU72.41.941.01Ser (S1)AGU16.40.440.37
Thr (T)ACC102.22.741.43Ser (S1)AGC34.60.930.78
Thr (T)ACA98.82.651.38Gly (G)GGU28.80.770.52
Thr (T)ACG13.10.350.18Gly (G)GGC81.52.181.47
Ala (A)GCU86.82.331.08Gly (G)GGA64.71.731.17
Ala (A)GCC152.64.091.89Gly (G)GGG46.91.260.85
Table 3. Variation analysis and base composition of 13 PCG genes in Rana.
GeneLength (bp)%Vs%Pis%Sts/tvKsKaKa/KsAT%AT- SkewGC- SkewAupd
ND196048.0241.676.354.260.980.080.0856.24−0.14−0.410.12
ND2103248.4540.797.664.190.850.080.0957.2−0.03−0.470.13
COI155136.5632.174.385.160.930.020.0254.83−0.09−0.210.02
COII68735.6630.714.955.990.780.030.0456.530.04−0.280.05
ATP815954.0942.1411.955.790.550.10.1861.890.04−0.470.21
ATP669345.7438.677.075.270.960.060.0657.35−0.11−0.470.09
COIII78335.5030.275.245.350.80.030.0453.58−0.14−0.280.05
ND333950.4444.845.604.260.530.090.1754.87−0.22−0.360.15
ND4L28250.0046.438.514.500.530.080.1555.84−0.11−0.400.12
ND4135944.8137.976.844.310.920.060.0756.81−0.08−0.410.09
ND5174057.9947.4110.573.461.080.140.1356.71−0.09−0.340.20
Cyt b114039.5633.516.054.181.000.030.0354.00−0.10−0.40.05
ND648650.4143.626.803.980.840.120.1452.81−0.310.540.16
Vs: variable sites, Pis: parsimony informative sites, S: singleton, ts/tv: the estimated transition/transversion bias, AT-skew = (A − T)/(A + T), GC-skew = (G − C)/(G + C), Aupd: The average uncorrected pairwise distances.
Publisher’s Note: MDPI stays neutral with regard to jurisdictional claims in published maps and institutional affiliations.

