-
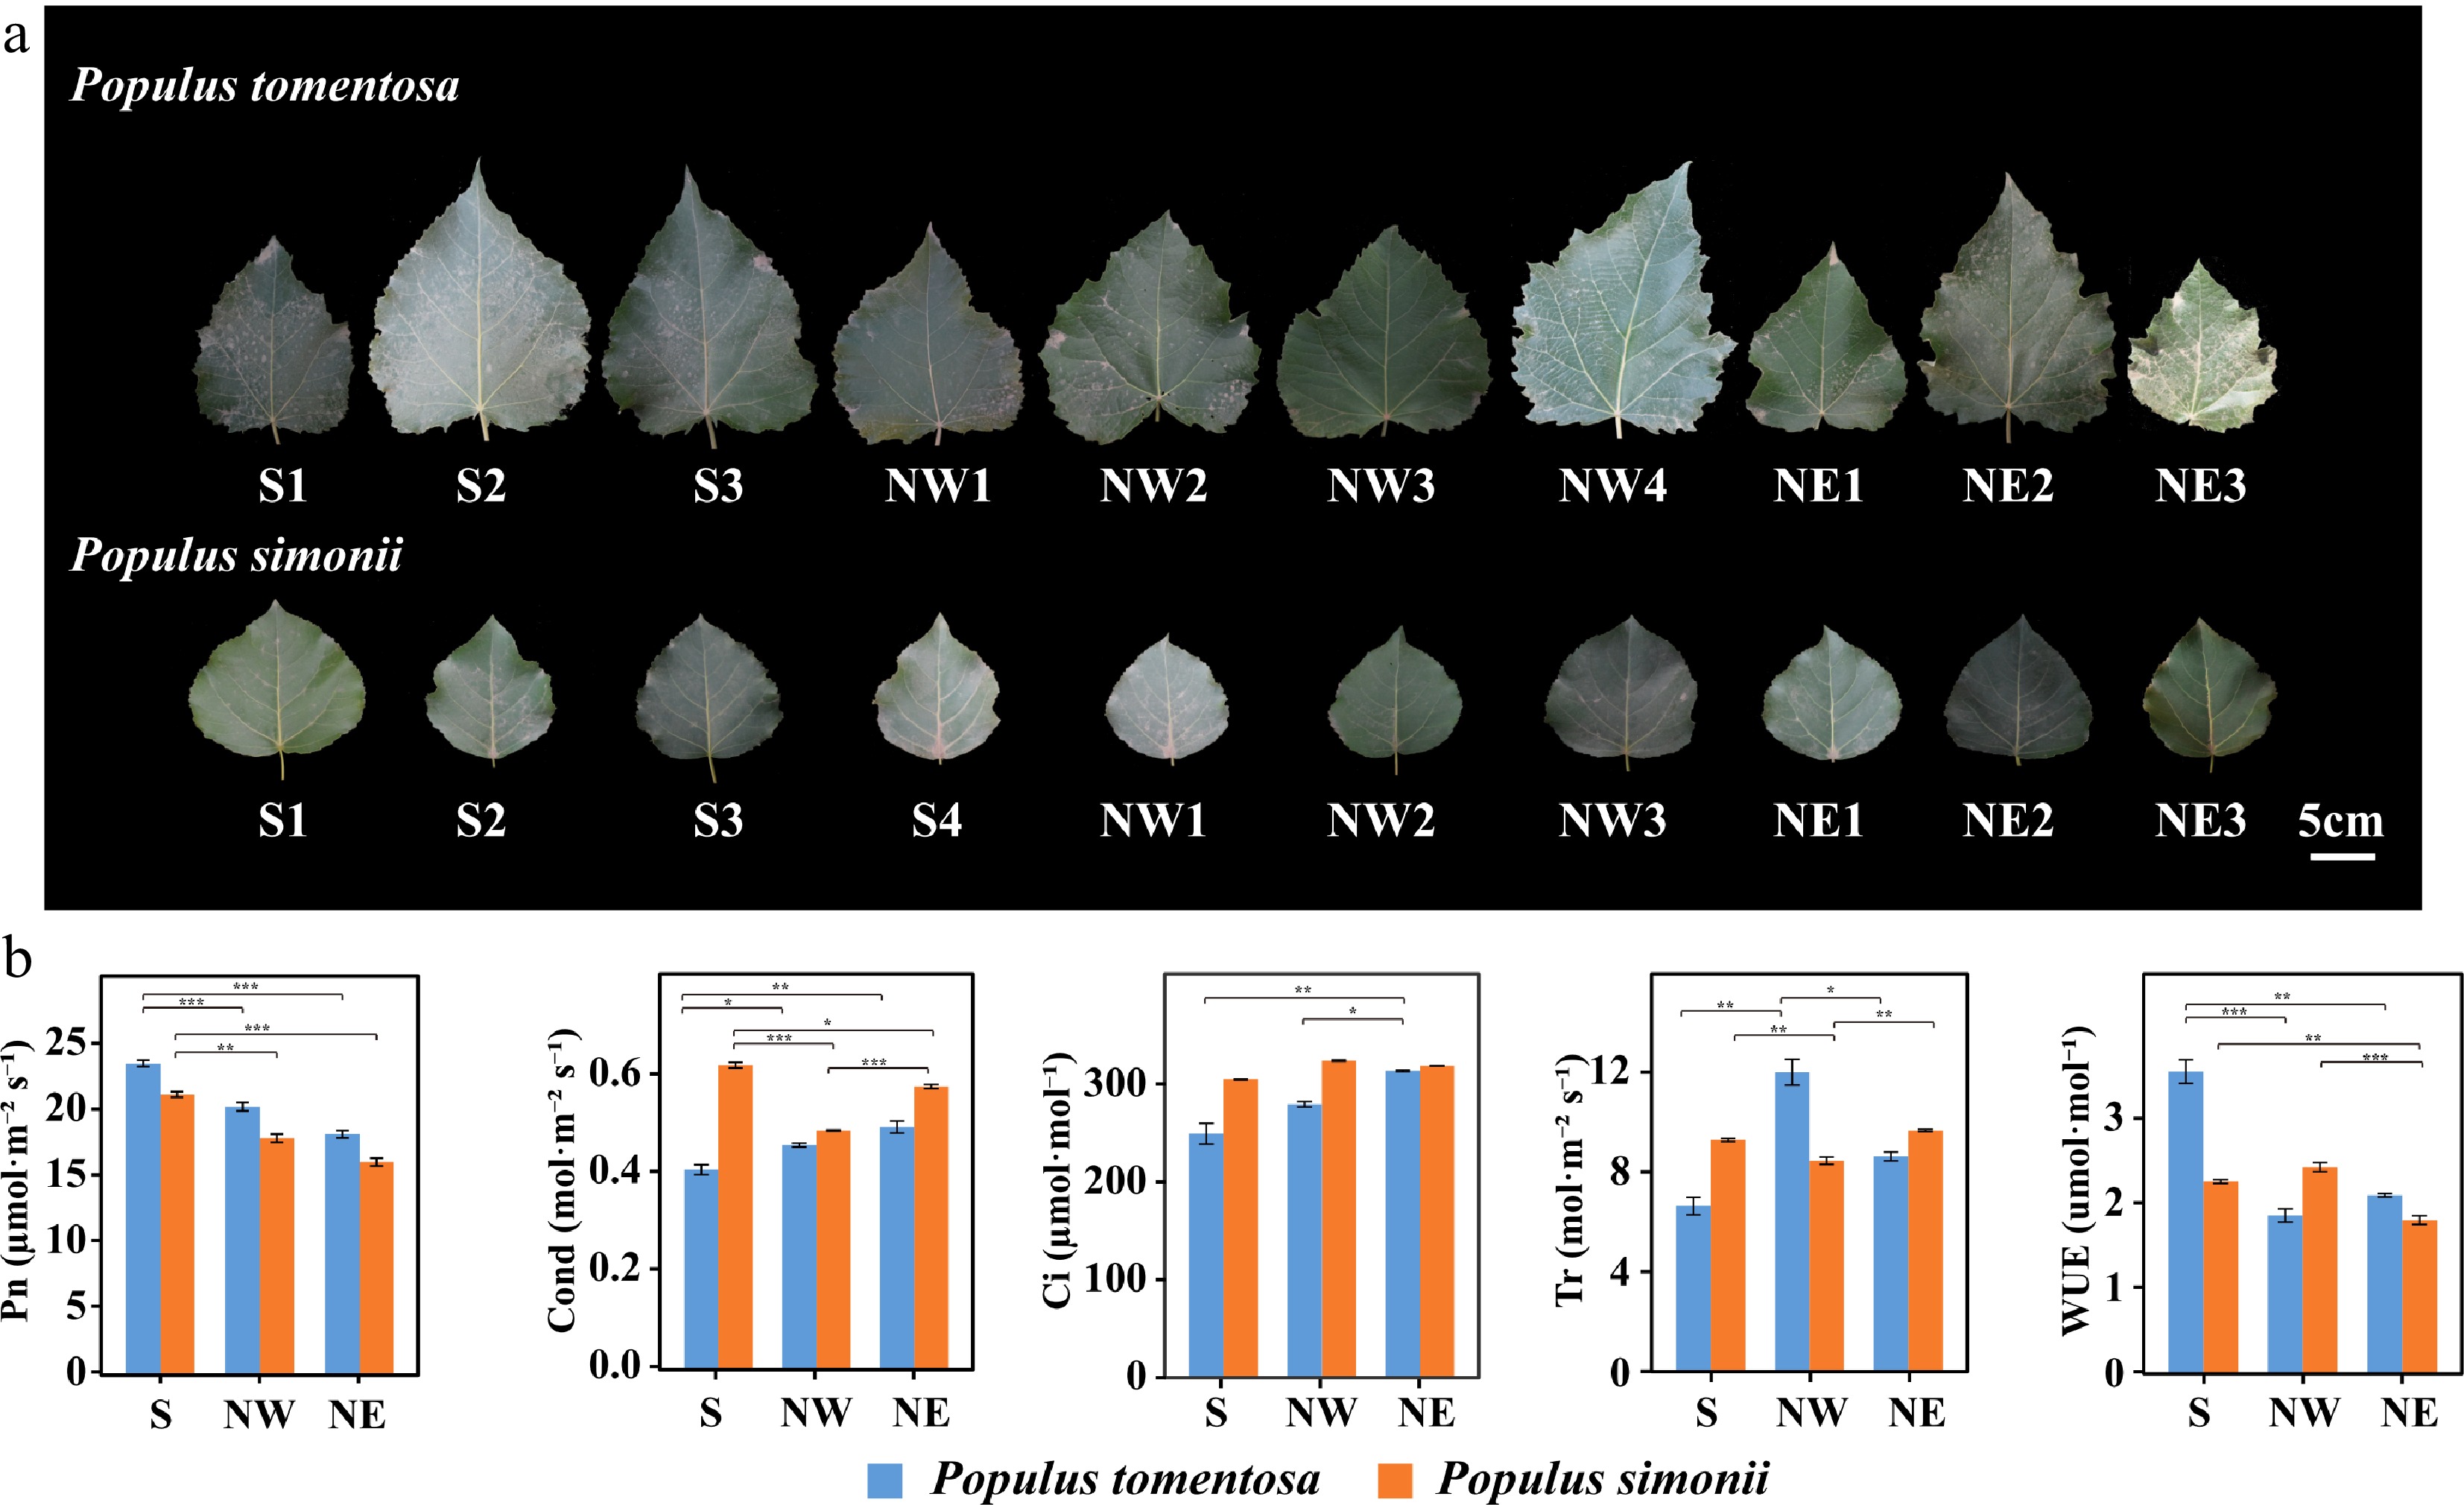
Figure 1.
Morphological and photosynthetic variation of Populus tomentosa and Populus simonii from different geographical regions. (a) Leaf size and shape of P. tomentosa and P. simonii from the Southern geographical region (S), the Northwestern geographical region, and the Northeastern geographical region (NE). Numbers represent accession number in its geographical region. Scale bar, 5 cm. (b) Photosynthetic traits of P. tomentosa (blue) and P. simonii (orange) from three geographical regions. Photosynthetic traits include net photosynthetic rate (Pn), conductance to H2O (Cond), intercellular CO2 (Ci), transpiration rate (Tr), and water use efficiency (WUE). Data represent means ± SE. *, p < 0.05; **, p < 0.01; ***, p < 0.001.
-

Figure 2.
Identification and characterization of lncRNAs in two Populus species. (a) Percentage distribution of different classifications of the total lncRNAs in Populus tomentosa and Populus simonii. (b) The GC content of lncRNAs and protein-coding genes (PCGs) in P. tomentosa and P. simonii. (c) Length density distributions of lncRNAs and PCGs. The x-axis indicates the log10-transformed sequence length and the y-axis indicates the density value. (d) Percentage distribution of exon numbers for PCGs and lncRNAs.
-
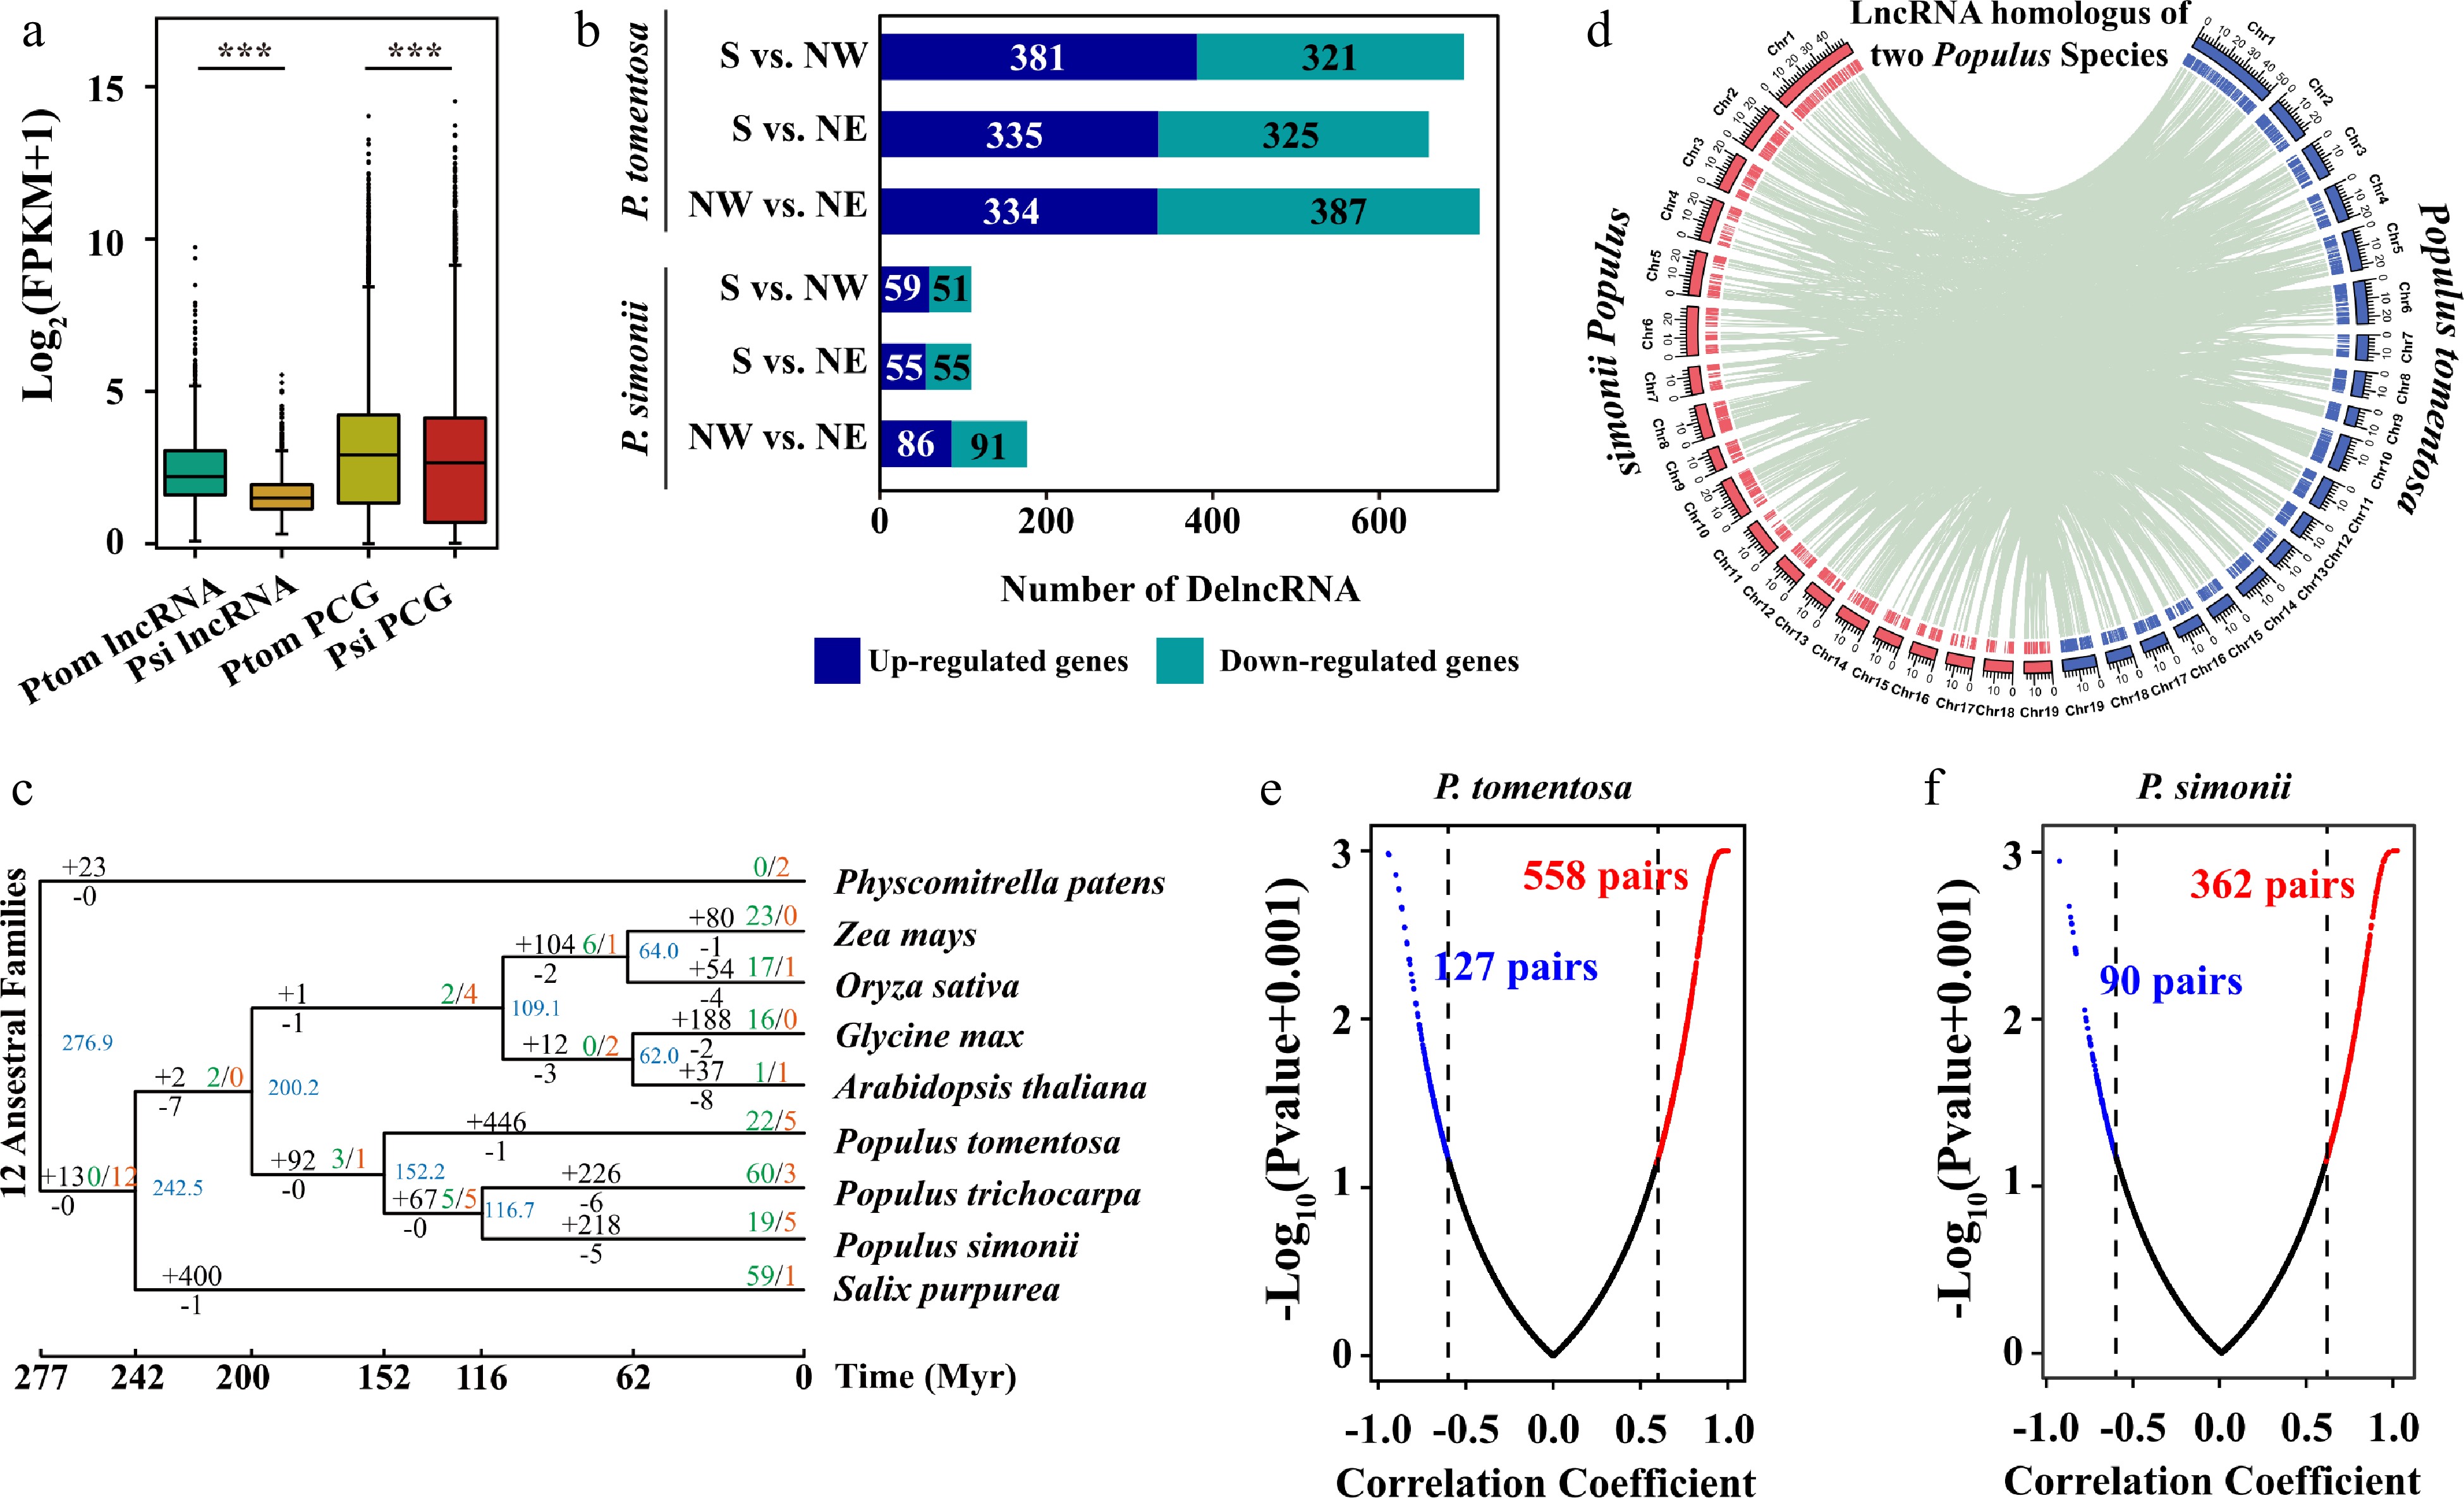
Figure 3.
Expression profiles and evolution of lncRNAs in Populus tomentosa and Populus simonii. (a) Box plot of expression levels of lncRNAs and protein-coding genes (PCGs) in P. tomentosa and P. simonii. Student t-test was used to calculate the p-value. *** p < 0.001. (b) The numbers of differentially expressed (DE) lncRNAs in P. tomentosa and P. simonii between accessions from the Southern geographical region and the Northwestern geographical region, the Southern geographical region and the Northeastern geographical region, the Northwestern geographical region and the Northeastern geographical region. (c) Phylogenetic tree and number of gene families displaying expansion (green) and contraction (red) among nine plant species. Branch lengths reflect evolutionary divergence times in million years (Myrs) inferred from timetrees. Numbers of gained (+) and lost (−) lncRNA families Myr–1 (in red) are indicated next to each branch. (d) The distribution of chromosomes (outer) and lncRNAs (inner) in P. tomentosa (blue) and P. simonii (red). The green lines in the inner rings show lnRNAs that were homoeologous in two Populus lineages. (e), (f) Scatter plots of Pearson correlation coefficient and p-value between the expressions of the lncRNAs and their target PCGs in P. tomentosa and P. simonii. The lncRNA-mRNA with correlation coefficient ≥ 0.6 (red) or ≤ −0.6 (blue), and p-value ≤ 0.05 are considered positive or negative pairs. For screen visualization, p-value were minus log10 transformed after a constant value (0.001) was added.
-
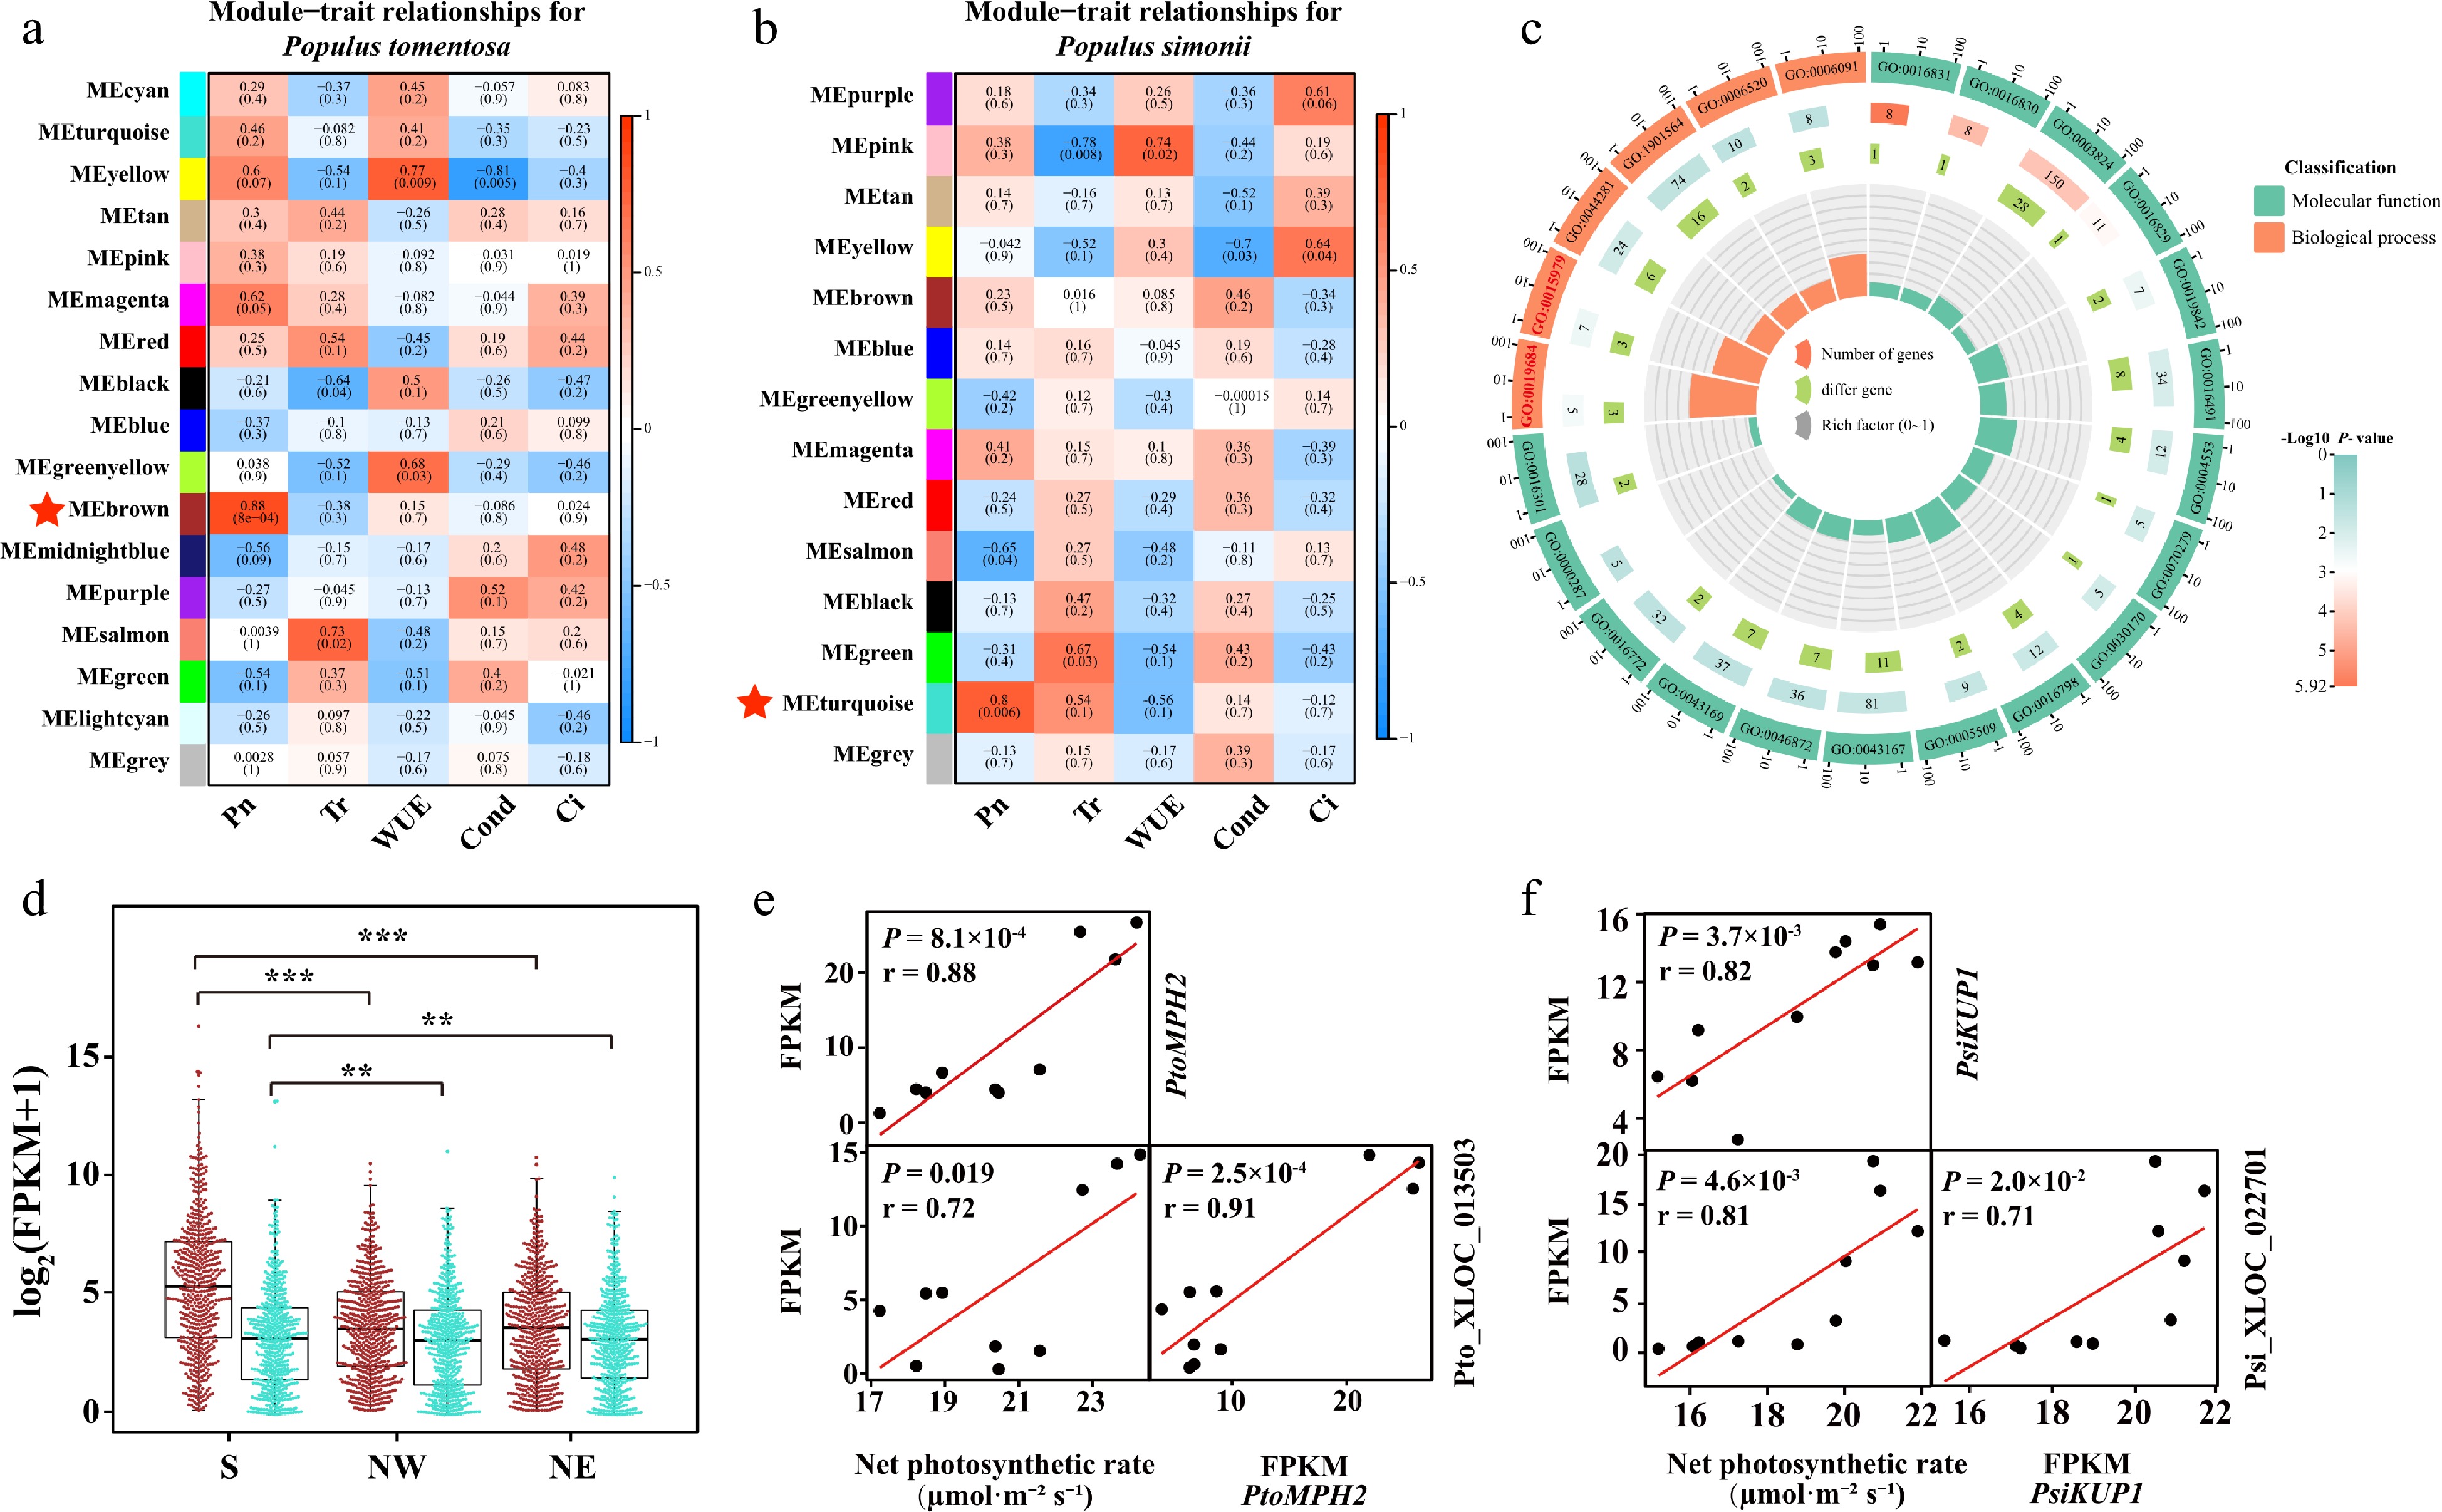
Figure 4.
Photosynthetic-associated modules in Populus tomentosa and Populus simonii. Statistical analysis of module–trait correlations in (a) P. tomentosa and (b) P. simonii. The rows and columns indicate the modules and traits, respectively. Cells are colored from blue to red according to the Pearson correlation coefficient in parentheses, and the star-marked cells indicate the highest significant association between the trait and its corresponding module. (c) Circos plot shows the enrichment and differentially expressed genes in each ontology of Module Brown in P. tomentosa. From the outer to the inner circle, is gene ontology (GO) id, number of genes and P -value, number of differentially expressed genes, and enrichment factors. (d) Box plot and beewarm plot of expression levels of lncRNAs and protein-coding genes (PCGs) in Module Brown from P. tomentosa and Module turquoise from P. simonii. Student t-test was used to calculate the p-value. *** p < 0.001, ** p < 0.01. (e) Scatter plots show correlation between the expression of PtoMPH2 and net photosynthetic rate, expression of Pto_XLOC_013503 and net photosynthetic rate, and between expression of PtoMPH2 and Pto_XLOC_013503. Pto_XLOC_013503 positively regulate a chloroplast thylakoid lumen protein, PtoMPH2. r, Pearson correlation coefficient; p, significance of the correlation between trait and gene expression. (e) Scatter plots show correlation between the expression of PtoMPH2 and net photosynthetic rate, expression of Pto_XLOC_013503 and net photosynthetic rate, and between expression of PtoMPH2 and Pto_XLOC_013503. r, Pearson correlation coefficient; p, significance of the correlation between trait and gene expression. (f) Scatter plots show correlation between the expression of PtoKUP1 and net photosynthetic rate, expression of Pto_XLOC_022701 and net photosynthetic rate, and between expression of PtoKUP1 and Pto_XLOC_022701. r, Pearson correlation coefficient; P, significance of the correlation between trait and gene expression.
-

Figure 5.
LncRNAs have positive regulatory roles for photosynthetic genes and working model of Psi_XLOC_022416. (a) Pto-XLOC_026190 and its regulatory gene (b) PtoPPL1. The RNA-seq coverage of the genes was extracted from the leaf transcriptomes of P. tomentosa accessions from the Southern geographical region (S), the Northwestern geographical region (NW), and the Northeastern geographical region (NE), and the numbers in the panel indicate the mapping read counts of junction reads or exonic reads. (c) Psi-XLOC_011671 and its regulatory gene (d) PtoNIP1. The RNA-seq coverage of the genes was extracted from the leaf transcriptomes of P. simonii accessions from the Southern geographical region (S), the Northwestern geographical region (NW), and the Northeastern geographical region (NE), and the numbers in the panel indicate the mapping read counts of junction reads or exonic reads. (e) A proposed working model of Psi_XLOC_022416 in regulating PsiPSBR and PsiLHCB7 expression to modulate Populus photosynthetic variation in different geographical regions.
-
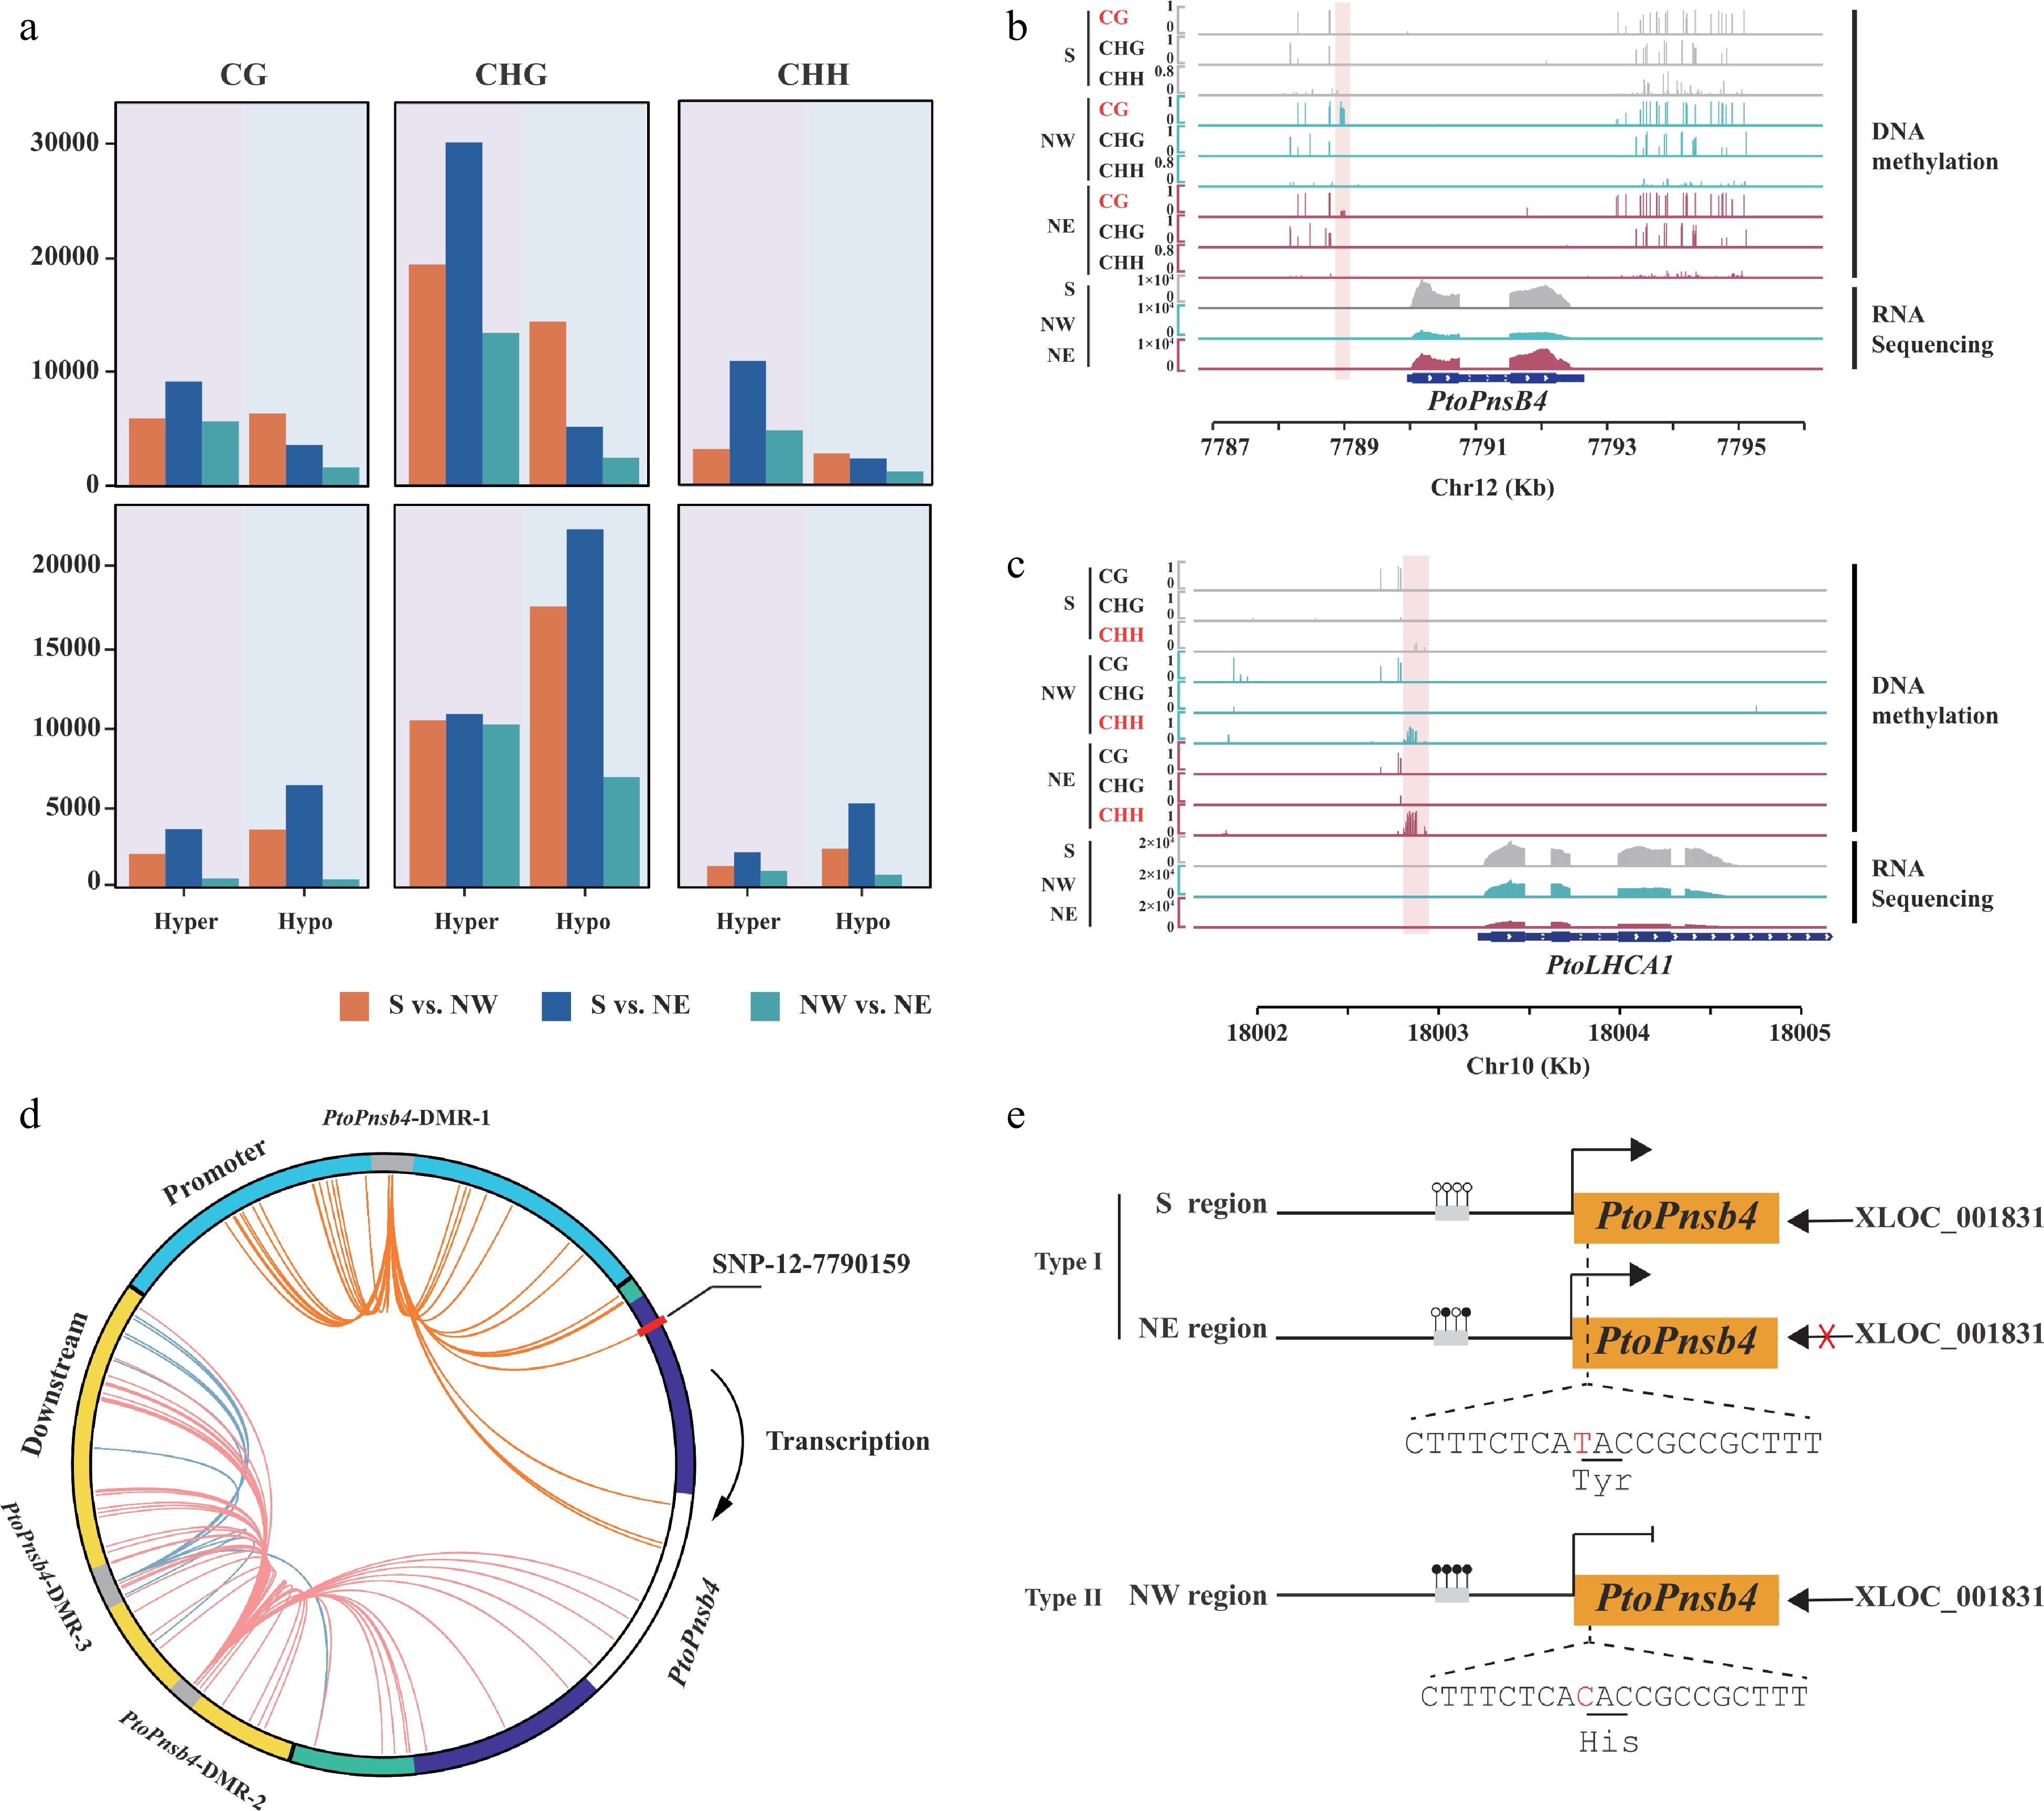
Figure 6.
Geographical variation of DNA methylation and genetic variation affect the function of lncRNA. (a) Count of hyper and hypo differentially methylated regions (DMRs) in P. tomentosa and P. simonii from three geographical regions in three contexts. (b), (c) Integrative Genomics Viewer plots of WGBS tracks in accessions from the Southern geographical region (S), the Northwestern geographical region (NW), and the Northeastern geographical region (NE), as well as RNA-seq tracks over (b) PtoPnsB4 and (c) PtoLHCA1. The position of the DMRs is indicated by the pink shadow area. (d) Circos plot representing interaction DMR-SNP pairs. The circles show the structure of gene PtoPnsB4. Blue, green, purple, white, and yellow arcs represent promoter, untranslated region (UTR), exon, intron, and downstream region, respectively. Interior lines represent the pairwise interactions of DMR-SNP pairwise. Orange, red, and blue lines indicate intra-gene interactions of different DMRs between DMR-SNP pairs. (e) A proposed working model that DNA methylation variation participates in the regulation of Pto_XLOC_001831that modulates Populus convergence evolution of photosynthesis.
Figures
(6)
Tables
(0)